Fig. 1.
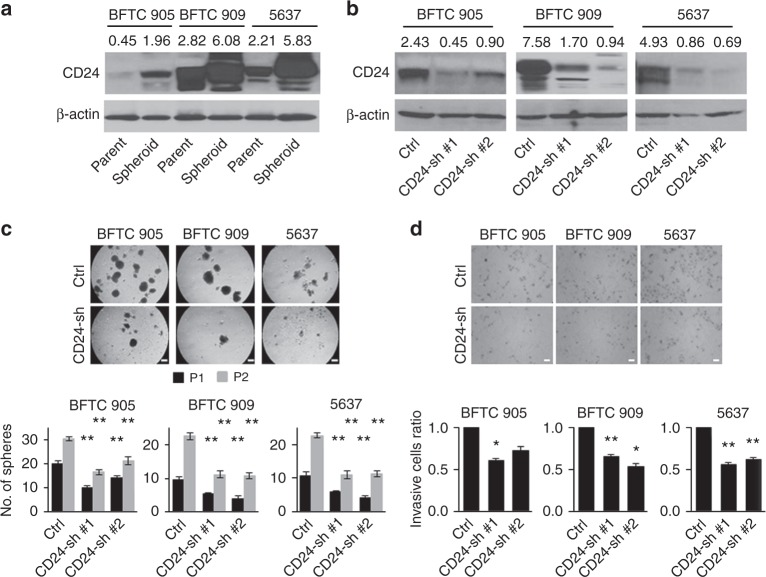
The sphere-forming and invasive abilities attenuated by CD24 knockdown in BFTC 905, BFTC 909, and 5637 cell lines. a Western blotting analysis of CD24 in isogeneic parental and spheroid cells. Upper, western blotting images; lower, expression levels of CD24 were quantified by myImageAnalysis™ Software and normalized to their respective β-actin. b Western blotting analysis of CD24 in stable CD24 knockdown (CD24-sh) and control (CD24-Ctrl) cells. Upper, western blotting images; lower, expression levels of CD24 were quantified relative to β-actin. c Sphere formation and self-renewal assays through the second (P2) passage from the first passage (P1) in stable CD24-sh cells compared with control CD24-Ctrl cells. Upper, representative images of sphere formation (scale bars, 200 μm); lower, number of the spheres over 100 µm. Data are from three independent experiments. d Invasion assay of spheroid CD24-sh cells. Upper, representative images (scale bars, 100 μm; lower, the relative number of invaded spheroid CD24-sh cells compared with spheroid CD24-Ctrl cells. Each error bar indicates mean ± SEM. *P < 0.05; **P < 0.01 (Wilcoxon–Mann–Whitney test)

