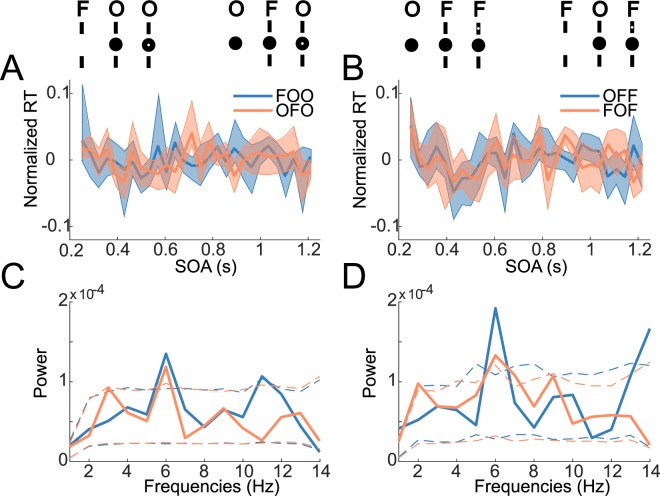
Figure 2.
Analysis of RT fluctuations for each condition. The four conditions are illustrated at the top for reference; they vary based on the order of presentation of the stimuli (Object-first or Flanker-first) as well as the site of target presentation (Object, Flanker). (A,B) RT time-series averaged across subjects (error bars indicate bootstrapped 95% CI) for each of the four conditions, grouped according to the site of target presentation (Object in A, Flanker in B). (C,D) Average power spectrum across subjects for each of the four conditions (grouped as previously). Dotted lines indicate the bootstrapped 95% confidence interval under the null hypothesis that all frequencies have similar power. We observed a significant peak at 6 Hz for all four sequence types.

