
. 2018 Sep 25;10(3):118–128. doi: 10.15171/jcvtr.2018.20
© 2018 The Author(s)
This is an open access article distributed under the terms of the Creative Commons Attribution License (http://creativecommons.org/licenses/by/4.0/), which permits unrestricted use, distribution, and reproduction in any medium, provided the original work is properly cited.
Figure 3.
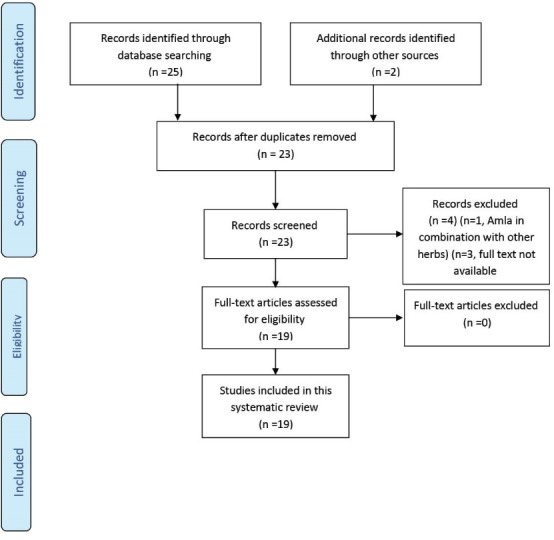
The PRISMA flow diagram of the study.