
Figure 3.
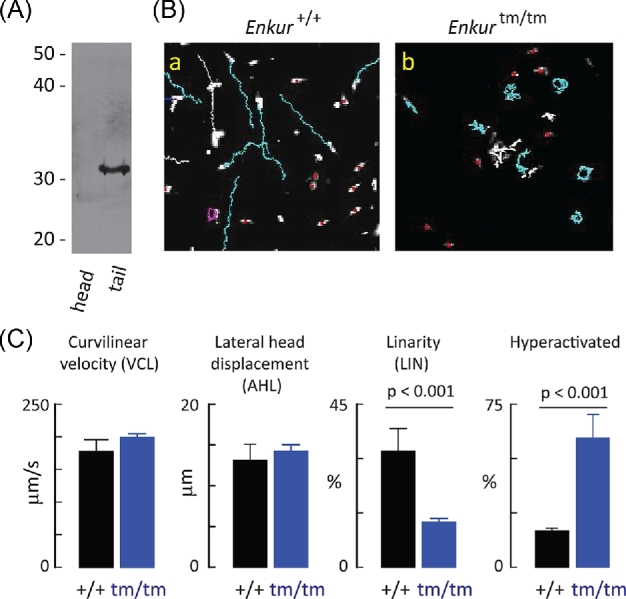
Kinematic effects of Enkur on sperm motility. (A) Immunoblot of isolated sperm heads and tails probed with anti-Enkur antibody. Enkur is detected only in the tail fraction. (B) Representative CASA traces of Enkur+/+ and Enkurtm/tm sperm following swim out from cauda epididymis. Genotype is indicated above the panels: Ba, Enkur+/+; Bb, Enkurtm/tm. Blue traces represent cases where sperm were tracked continuously during the 20-s acquisition period. This population was used for kinematic analysis. Other colors represent cells that were not tracked continuously throughout the acquisition window and were not analyzed further. (C) Kinematic properties of Enkur+/+ (five independent experiments, 673 total sperm) and Enkurtm/tm sperm (four independent experiments, 357 total sperm). Fraction of sperm that exhibited hyperactivation-like motility was calculated as described [42]. Data represent means ± SD (horizontal line above bars represents statistical differences by two tailed t-test). (Please see the online version for the color figure).