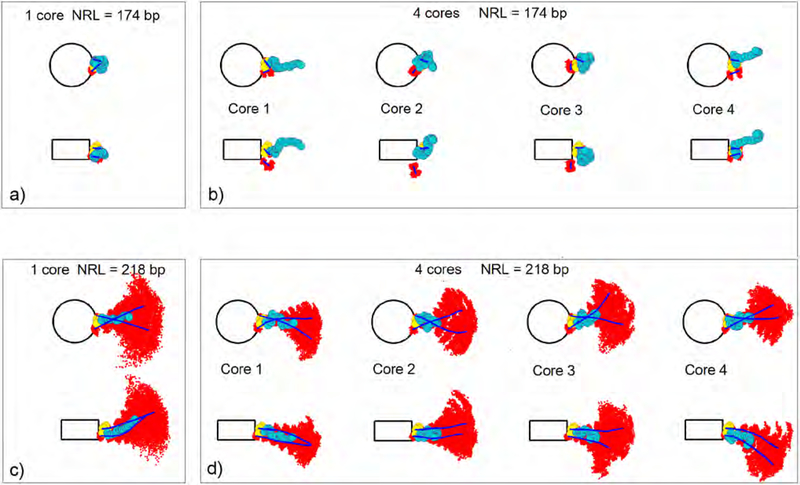
Figure 5.
Linker DNA distribution for typical fiber configurations in mononucleosomes and 4-nucleosome arrays, for shortest (174 bp) and longest (218 bp) NRLs projected on the nucleosome and dyad plane. The clouds of red dots represent linker DNA bead positions. The mean trajectories of the DNA linkers are shown as blue lines. The average positions of linker histone beads are shown as yellow (GH) and turquois (CTD) circles.

