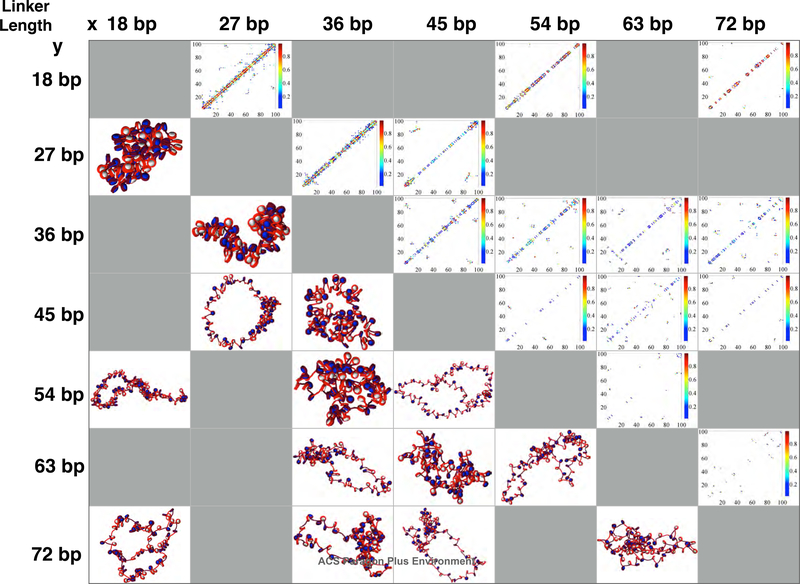
Figure 4:
Matrix of structures (lower triangle) and contact maps (upper triangle) for various combinations of linker lengths randomly distributed throughout the 100 core fibers. Systems near the top left (shortest linkers) are the most compact fibers, and fibers become less condensed locally as linker lengths increase. Kb range contacts are strongest for systems with 36 and 45 bp, the median average linker length for living systems.

