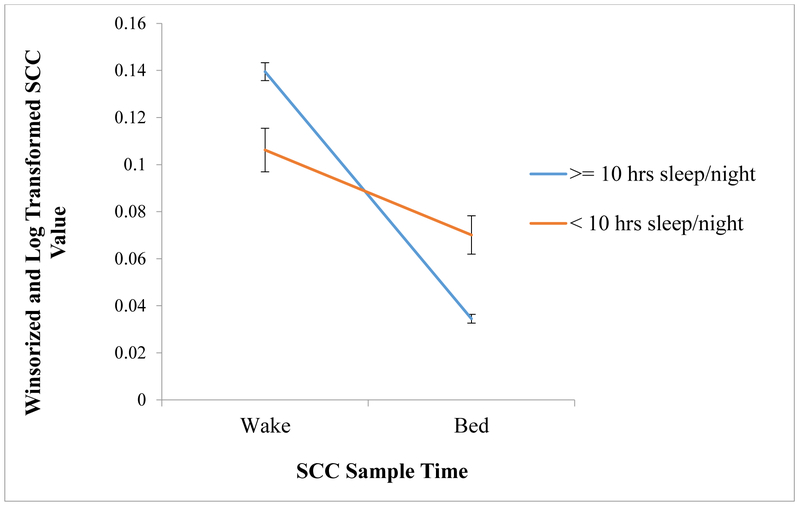
Figure 1.
Slope across the day by sleep duration classification
Note. Y-axis indicates SCC value after winsorizing and log transformation. Standardized SCC values were not used in order to make it easier to interpret the slope across the day. X-axis indicates the SCC sample time, showing the decline in basal SCC across the day.

