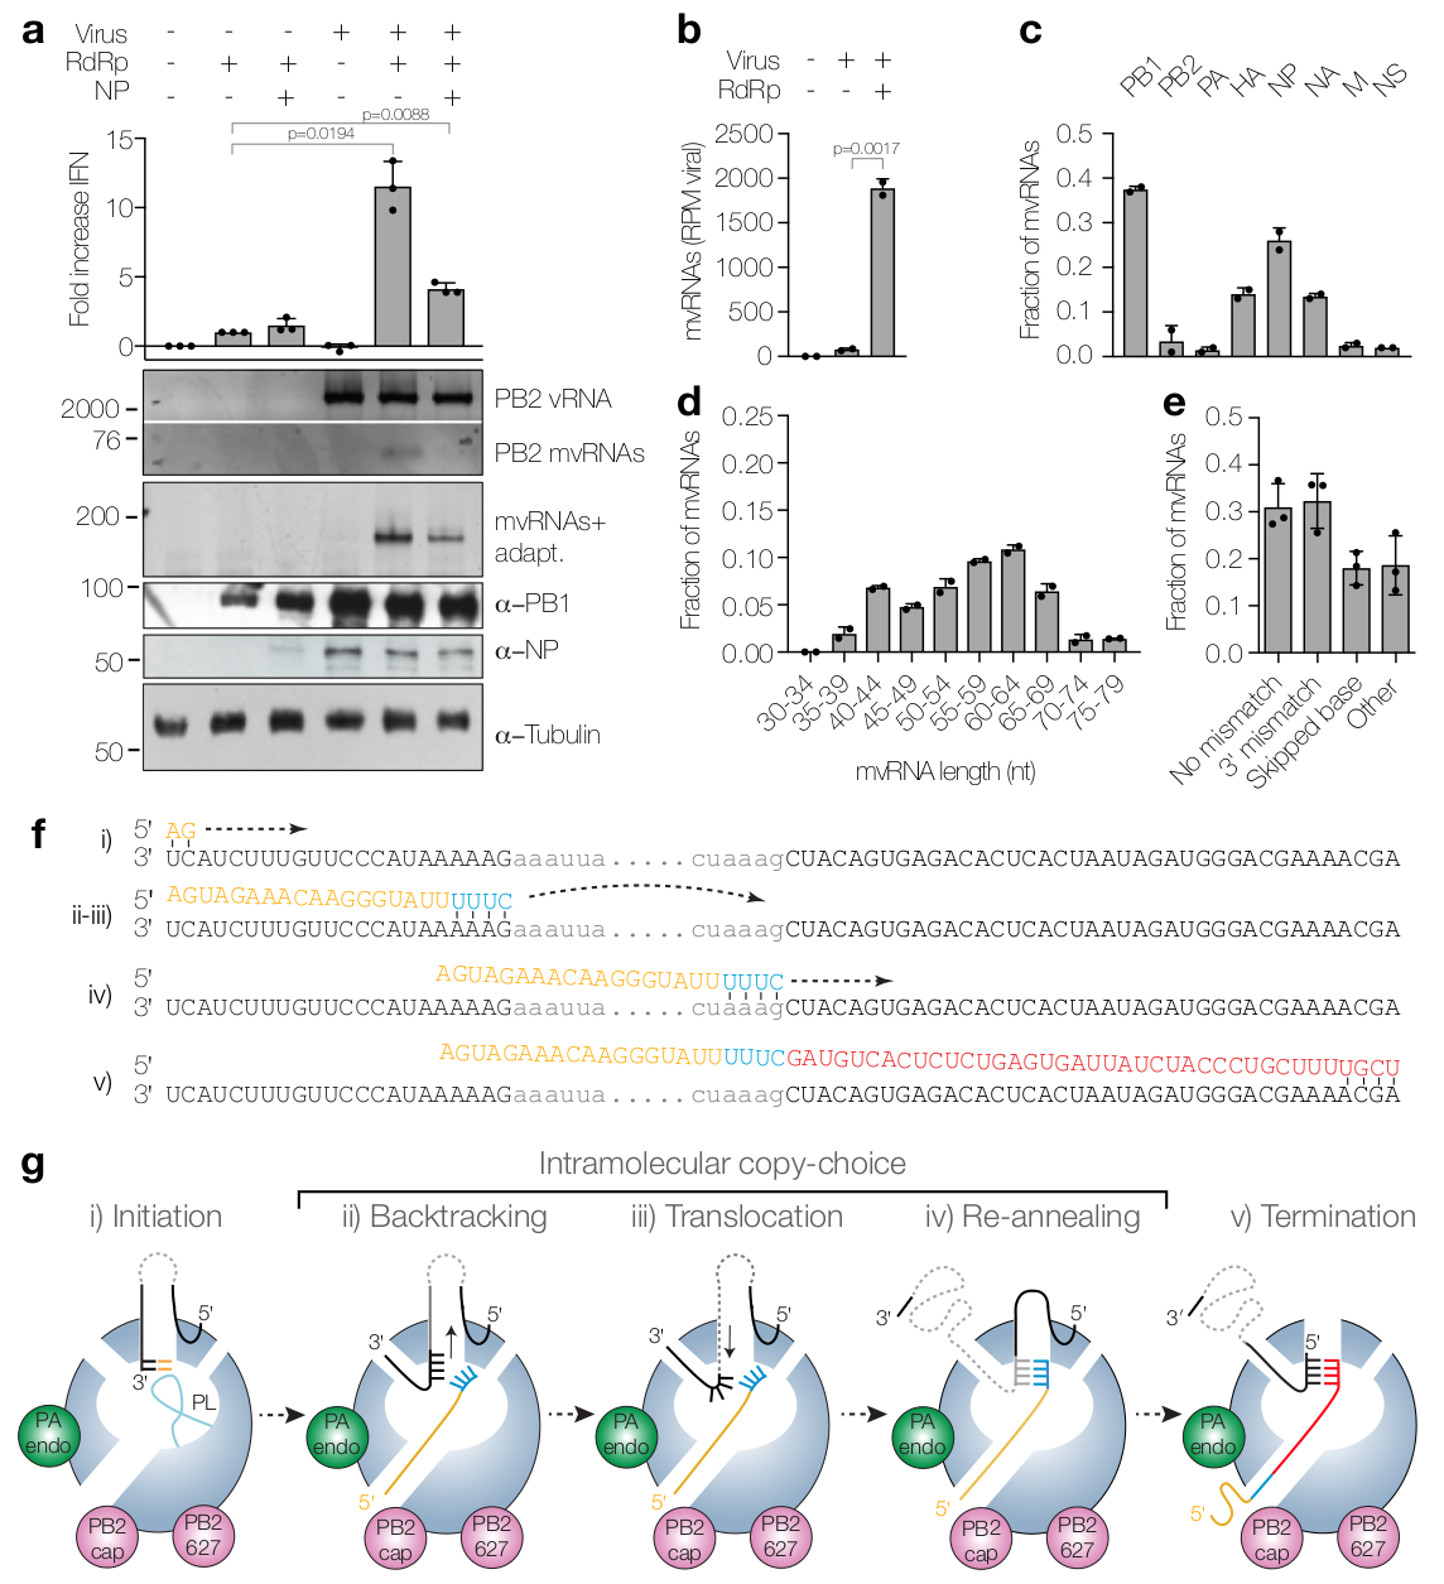
Figure 2. Dysregulation of RNA replication in cells infected with WSN results in the generation of mvRNAs.

(a) Analysis of IFN-β promoter activity (graph) and steady state vRNA and mvRNA levels (top gel) in WSN infections following overexpression of viral polymerase or viral polymerase and NP. mvRNAs were also amplified with universal primers containing adapters for sequencing (mvRNAs+adapt) and analysed by PAGE (second gel). NP, PB1 and tubulin expression was analysed by western blot. P-values were determined using ANOVA compared to lane 2. (b) Quantitation of mvRNAs using deep sequencing, expressed as reads per million (RPM). P-value was determined using a two-sided unpaired t-test. (c) mvRNA distribution per genome segment. (d) Size distribution of mvRNAs. (e) mvRNA distribution per type of intramolecular copy-choice mechanism. (f) Example of mvRNA formation through an intramolecular copy-choice mechanism involving a 3′ mismatch. (g) Model of mvRNA formation by the polymerase (model adapted from6). All graphs show standard deviation and mean of data from two (n=2) (b-d) or three (n=3) (a,e) biologically independent experiments.
