
Figure 4. Levels of mvRNAs produced during infection correlate with innate immune responses.
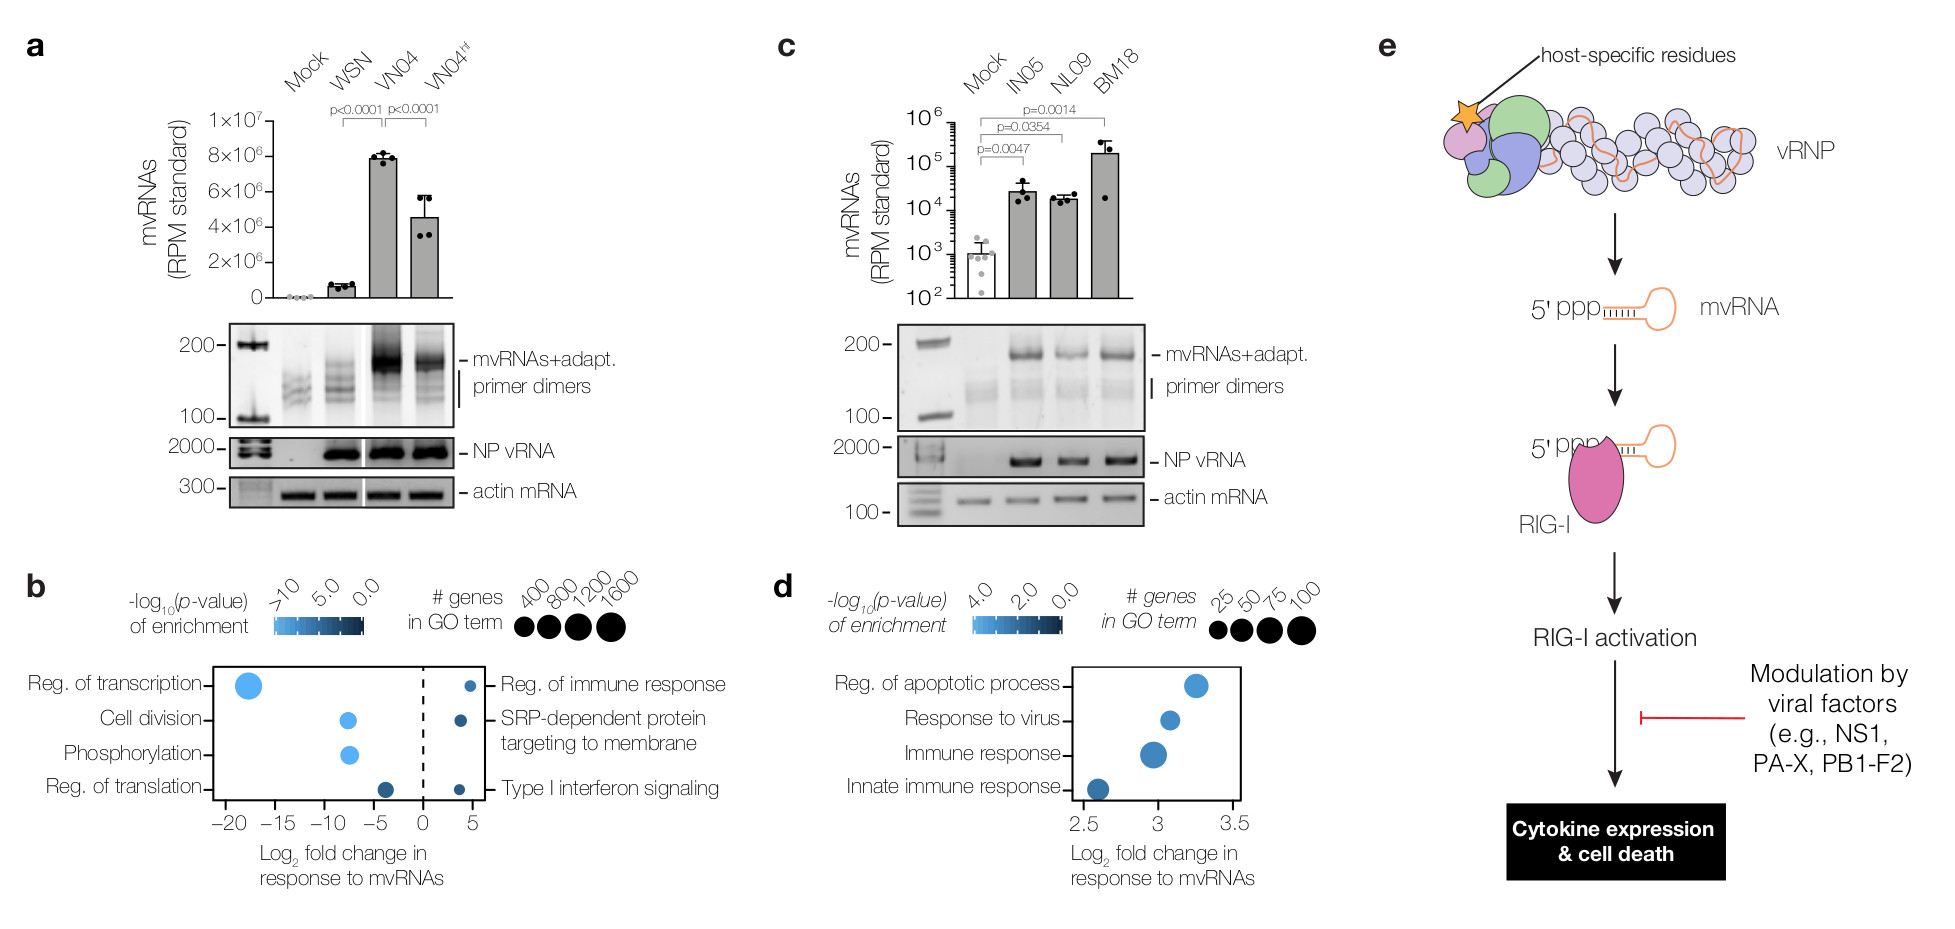
(a) Analysis of mvRNAs in A549 cells infected with WSN, VN04, VN04hf using deep sequencing or PAGE. mvRNAs were amplified using universal primers containing adapters for sequencing (mvRNAs+adapt). mvRNA counts were normalised to mvRNA and mcRNA internal standards. NP vRNA and actin mRNA levels were analysed by RT-PCR. P-values were determined using ANOVA with adjustments for multiple corrections compared to the mock. (b) Analysis of mRNAseq of infected A549 cells showing GO terms down-regulated (left) and GO terms up-regulated (right) in VN04 infection as compared to VN04hf in response to mvRNA levels. P-values were determined using a one-sample z-test (see Methods). Data are from n=4 biologically independent experiments (a,b). (c) Analysis of mvRNAs in lungs of ferrets one day after infection with IN05, NL09 or BM18 using deep sequencing or PAGE. NP vRNA and actin mRNA levels were analysed by RT-PCR. P-values were determined as in a. (d) Analysis of tissue mRNAseq showing GO terms enriched as function of mvRNA levels in lungs of ferrets infected with IN05, NL09 and BM18 influenza viruses. Data are from n=4 biologically independent experiments with separate mock samples for BM18, and IN05 and NL09 (c,d). One BM18 ferret was excluded from the analysis. P-values were determined as in b. (e) Model for the expression of cytokines in influenza virus infected cells. In a and c graphs show standard deviation and mean.