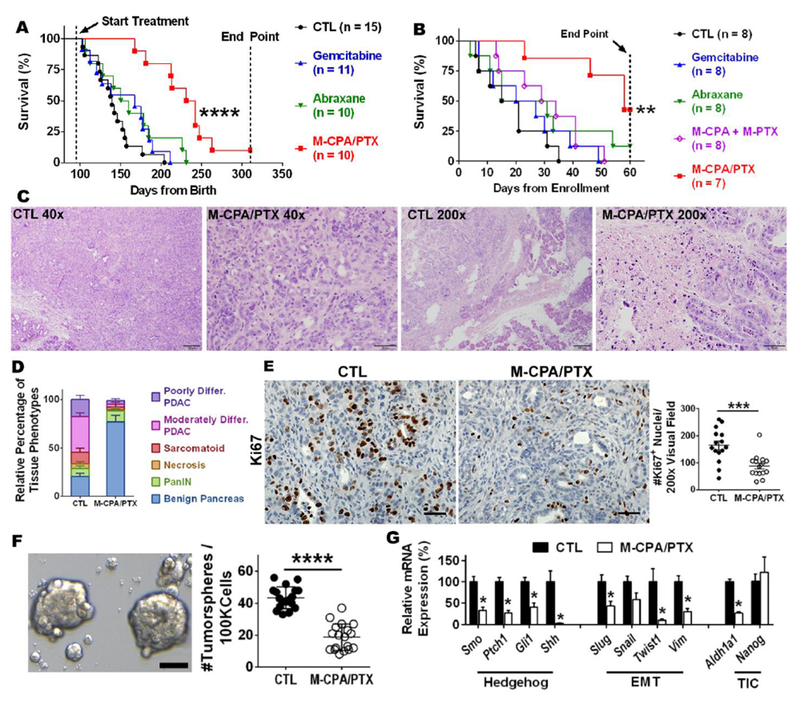
Figure 4. M-CPA/PTX prolonged survival of KPC-Luc mice and alleviated hypoxia.

(A) Kaplan-Meier survival analysis for KPC-Luc mice with early treatment. ****p < 0.0001, log-rank test. (B) Kaplan-Meier survival analysis for KPC-Luc mice with treatment started when tumors became palpable. ***p = 0.0033, log-rank test. (C) Representative H&E-stained sections of late-stage tumors after 2 weeks of treatment with M-CPA/PTX. Untreated tumors were used as control (CTL). Scale bars = 200 µm for 40× images and 50 µm for 200x images. (D) Distribution of histological phenotypes of late-stage tumors after 2 weeks of treatment with M-CPA/PTX (N = 10). Untreated tumors were used as CTL (N = 8). The M-CPA/PTX-treated tumor group had a significantly lower proportion of poorly differentiated PDAC (p < 0.05) or moderately differentiated PDAC (p < 0.0001) and a significantly higher proportion of benign pancreas (p < 0.0001). Significance of differences was determined using 2-way ANOVA followed by Sidak’s multiple comparison test. differ. = differentiated. (E) Representative micrographs of Ki67 IHC staining and corresponding quantifications. N = 15 in each group. Scale bars = 50 µm. (F) Representative micrographs of tumor spheres and corresponding quantifications. N = 18 for each group. Arrows indicate eligible tumor spheres (>50 µm). Scale bars = 50 µm. (G) Expression levels of mRNA for selected genes from CTL and M-CPA/PTX-treated tumors. Results are mean ± SEM of 4 mice in each group. RT-PCR was performed in technical duplicates, and values were normalized to 18S. Significance of differences between CTL and M-CPA/PTX groups was determined using Student’s unpaired t test. *p < 0.05, **p < 0.01, ***p < 0.001, ****p < 0.0001, ns = not significant.
