
Fig. 9.
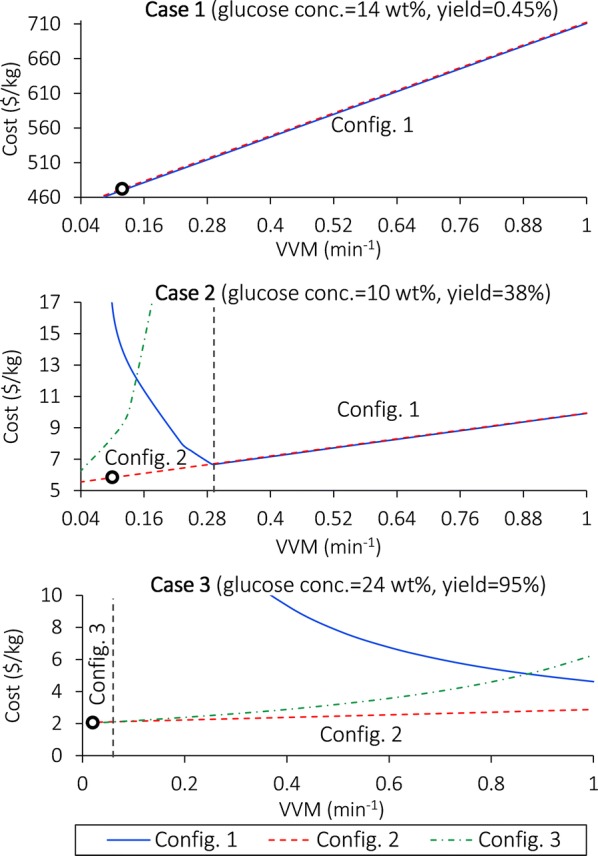
Cost comparison between configurations with varying VVM values in different cases. The vertical dashed lines denote threshold VVM values where the cost-minimal configurations change; the optimal configurations are labeled in the corresponding regions. The three cases are represented by the small circles. Note that VVMMIN = 0.090, 0.040, and 0.0079 min−1 for Cases 1–3, respectively