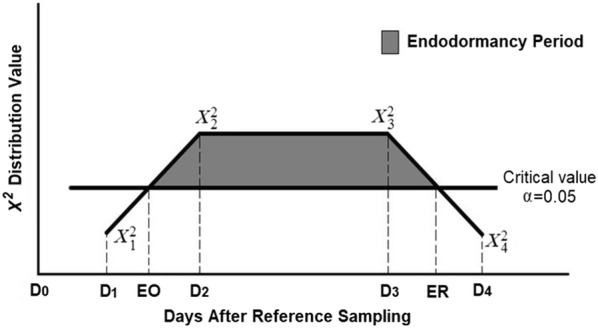
Fig. 1.

Representation of the linear interpolation for estimation of the dates of endodormancy onset (EO) and endodormancy release (ER). The vertical axis represents the X2-value of the comparison between the sample taken at date Di against the reference sample taken at D0, with a family-wise error (FWE) α = 0.05
