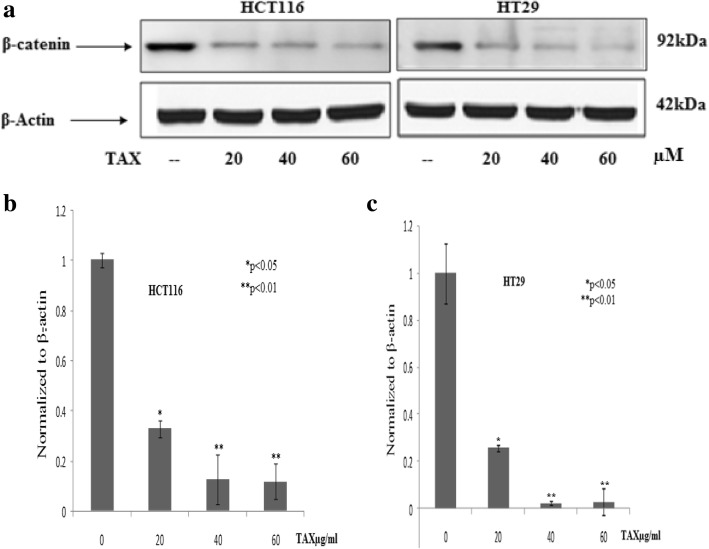
Fig. 6.
a Immunoblot analysis of β-catenin expression of HCT116 and HT29 in TAX administrated group as compared to control group (b, c) qPCR analysis of TAX administrated HCT116 and HT29 cells for changes in β-catenin mRNA levels. The data expressed as fold change represent the mean ± standard errors experiment performed in triplicate where*p < 0.05,**p < 0.01 was considered significant vs control

