
Fig. 7.
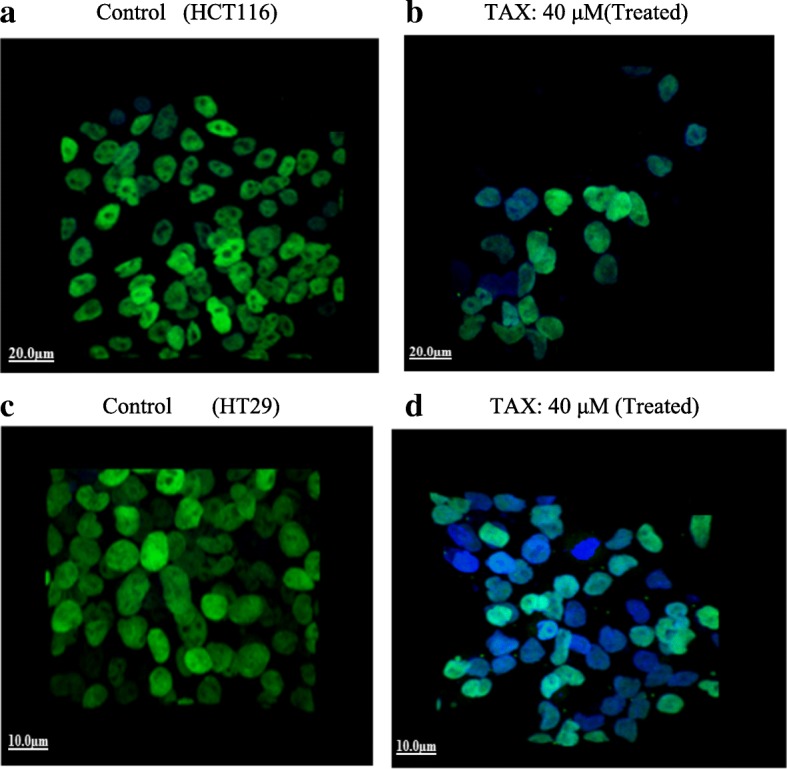
Imunofluorescence staining of HCT116 (b) and HT29 cells (d) demonstrating expression of β-catenin in both TAX treated (40 mol/L) as compared to control HCT116 (a) and HT29 (c) cells (untreated). Alexa fluor staining of TAX of both cell lines (green fluorescence) and counter stained with DAPI (blue fluorescence) were seen