
Fig. 8.
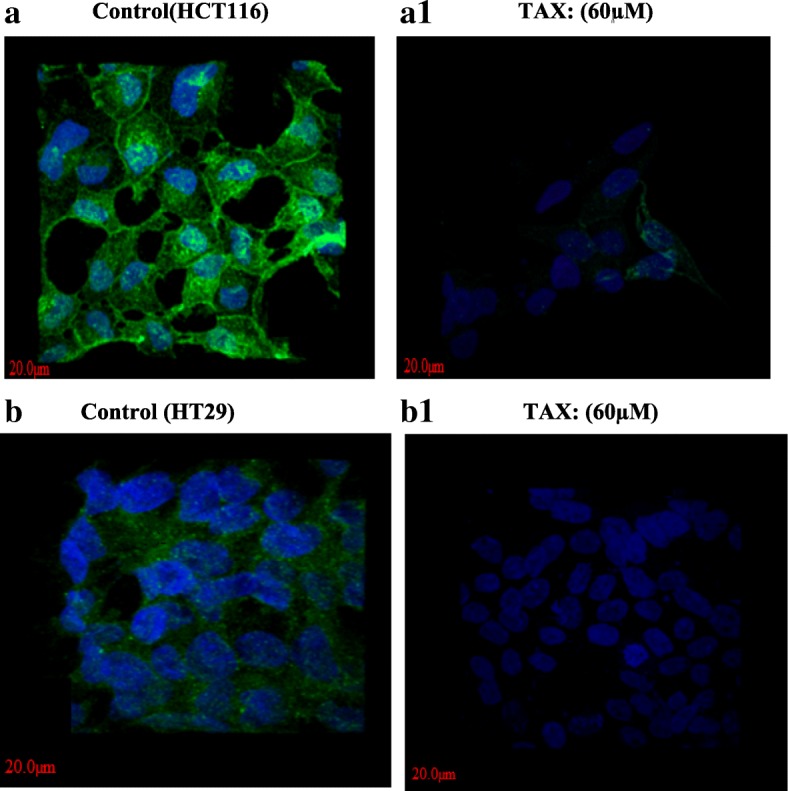
Imunofluorescence staining of HCT116 (A1) and HT29 cells (B1) demonstrating expression of p-AKT in both TAX treated as compared to control HCT116 (a) and HT29 (b) cells (untreated). Alexa fluor staining of p-AKT of both cell lines (green fluorescence) and counter stained with DAPI (blue fluorescence) were observed