Fig. 1.

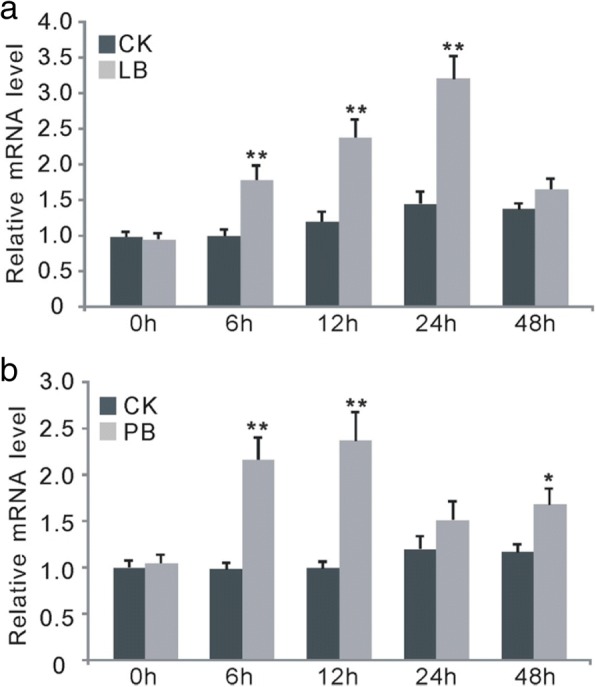
The expression pattern of OsWRKY67 after blast fungus infection. The values are means ± standard deviations (SDs) of three biological replicates, and asterisks represent significant differences relative to the water treatment (0 h) (t-test, **P < 0.01 and *P < 0.05). a The transcription of OsWRKY67 was activated by leaf blast infection. LB = leaf blast. b The transcription of OsWRKY67 was activated by panicle blast infection. PB = panicle blast
