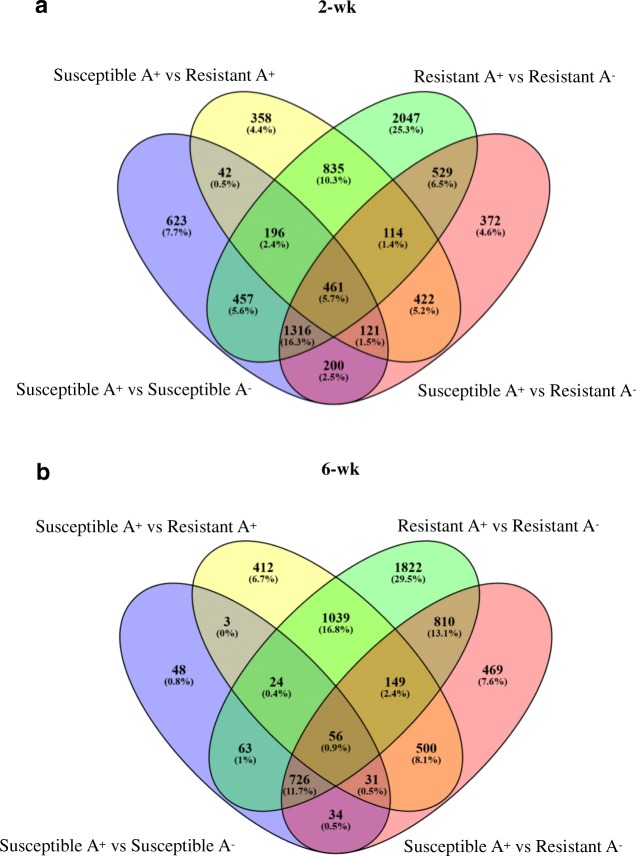
Fig. 2.
Venn diagram of DEGs in susceptible and resistant sorghum genotypes exposed to sugarcane aphid herbivory. DEGs were compared in 2-wk (a) and 6-wk (b) sorghum plants in response to aphid herbivory (A+) and in aphid-free (A−) plants. All overlapped and unique DEGs from different comparisons are shown

