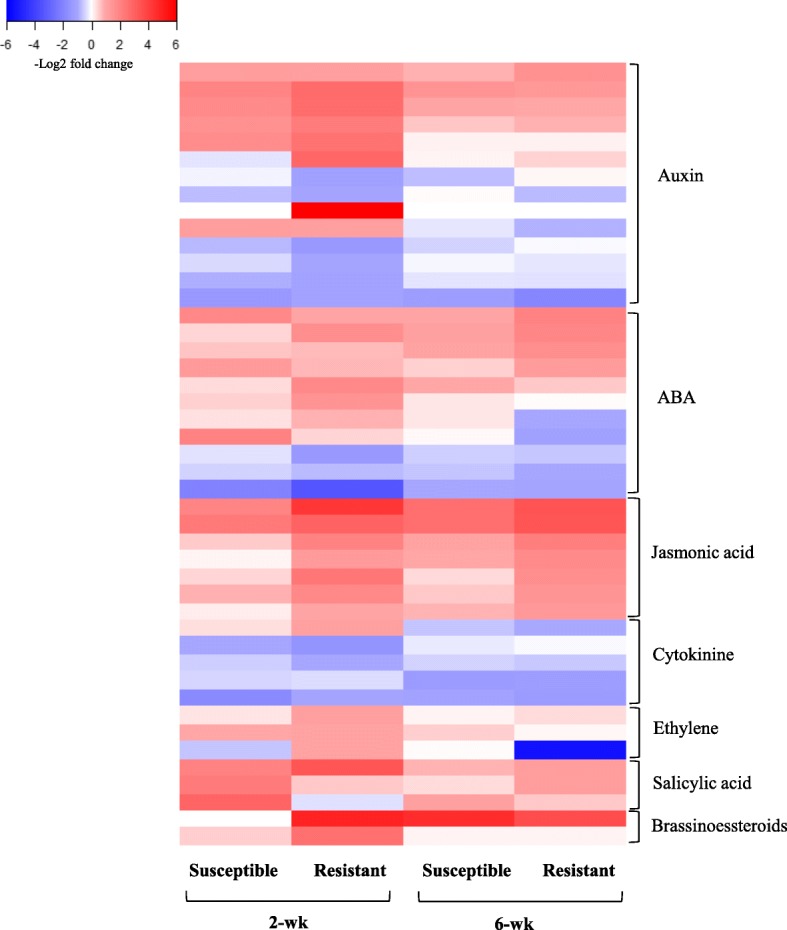
Fig. 5.

Heat map of DEGs involved in hormone transduction pathways in response to aphid herbivory. Heat map shows DEGs across two resistant and susceptible sorghum genotypes at 2- and 6-wk post-emergence. The color key represents log2-transformed fold changes and red indicate increased expression in response to aphid, while blue represents a decrease in expression
