
Fig. 1.
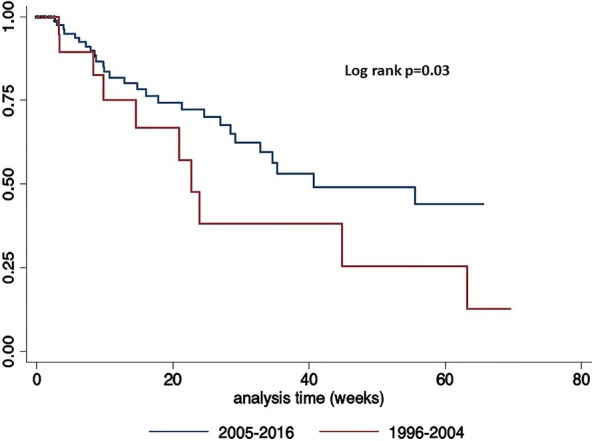
Kaplan–Meier curve showing patients with relapse or progression since NADC diagnosis until last hospital visit, according to pre-cart (1996–2004) and post-cART (2005–2016)
Official websites use .gov
A
.gov website belongs to an official
government organization in the United States.
Secure .gov websites use HTTPS
A lock (
) or https:// means you've safely
connected to the .gov website. Share sensitive
information only on official, secure websites.
Kaplan–Meier curve showing patients with relapse or progression since NADC diagnosis until last hospital visit, according to pre-cart (1996–2004) and post-cART (2005–2016)