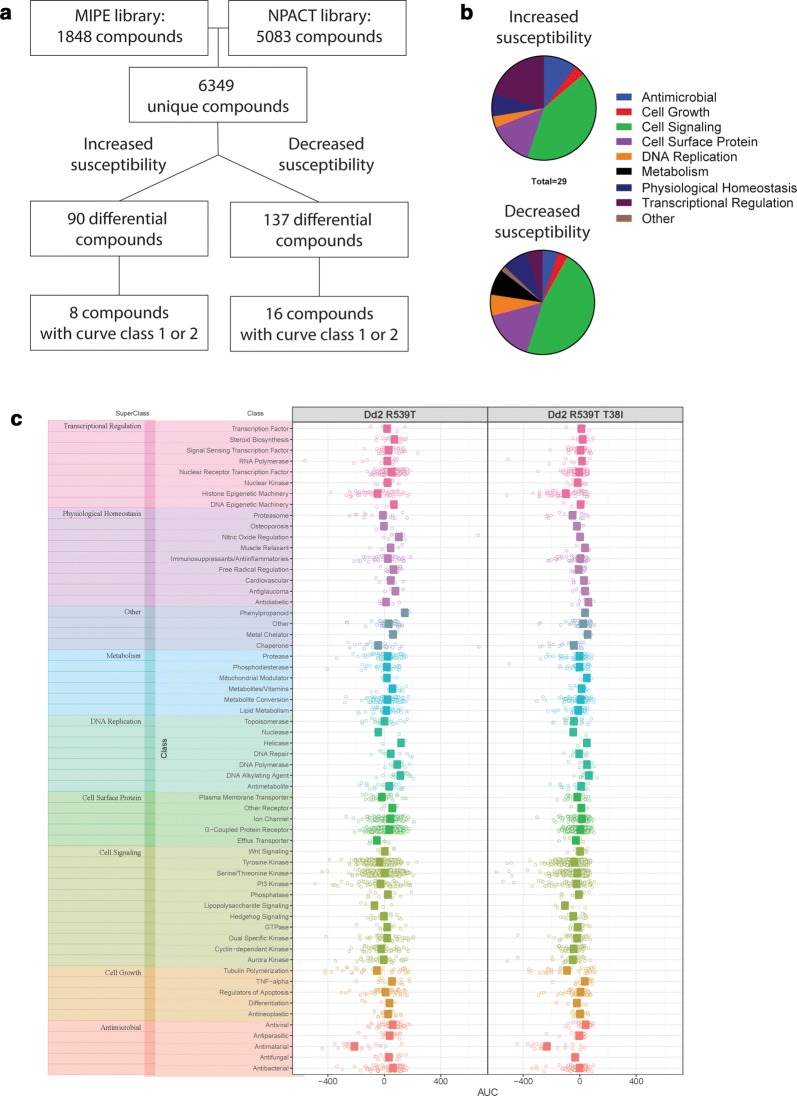
Fig. 5.
Overview of drug screen against atg18 isogenic lines. a NCATS libraries MIPE and NPACT were used to screen 6349 unique compounds. The atg18 T38I SNP was associated with increased susceptibility to 90 compounds. Of these, 8 compounds demonstrated curves in curve classes 1 or 2, demonstrating a shift in susceptibility. On the other hand, this SNP was associated with decreased susceptibility to 137 compounds, 16 of which showed curve classes 1 or 2. b The atg18 T38I SNP was associated with increased susceptibility to 90 compounds, 29 of which have known mechanisms of action. The SNP caused decreased susceptibility to 137 compounds, of which 62 were annotated. Drugs are categorized into antimicrobial (blue), cell growth (red), cell signaling (green), cell surface protein (purple), DNA replication (orange), metabolism (black), physiological homeostasis (navy), transcriptional regulation (crimson), or other (tan). c AUC values for parent (Dd2R539T) and mutant (Dd2R539T/T38I) lines organized by superclasses: transcriptional regulation (pink), physiological homeostasis (purple), other (periwinkle blue), metabolism (sky blue), DNA replication (aqua), cell surface protein (green), cell signaling (olive), cell growth (orange), and antimicrobial (coral). These are further broken down into classes by line

