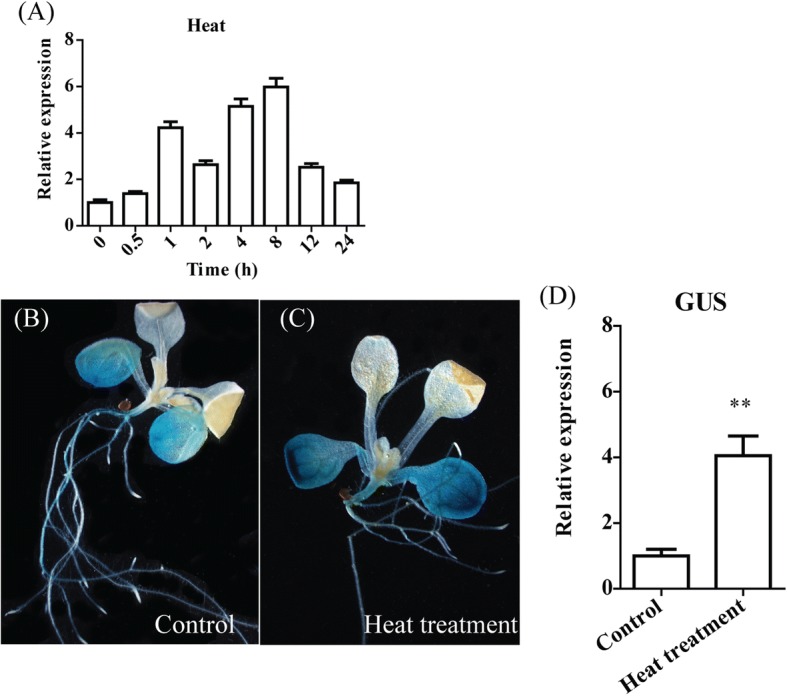
Fig. 1.

Relative and spatial expression patterns of TaBI-1.1. a Expression profile of TaBI-1.1 under heat treatment for 0, 0.5, 1, 2, 4, 8, 12, and 24 h. Wheat Actin was used as a reference. The vertical coordinates are the fold-changes, and the horizontal ordinates are the different time periods. b and c GUS activity of PBI::GUS transgenic Arabidopsis under normal conditions (b) and heat treatment (c) was detected via GUS histochemical staining. Seedlings grown under normal conditions were used as controls. d GUS expression levels in the PBI:GUS transgenic lines were monitored by qRT-PCR. Actin2 was used as a reference. The results are shown as the means±standard deviation (SD) of three biological replicates. Error bars indicate the SD. Asterisks (**) indicate the significant differences (P < 0.01) compared with Col-0 (Student’s t-test)
