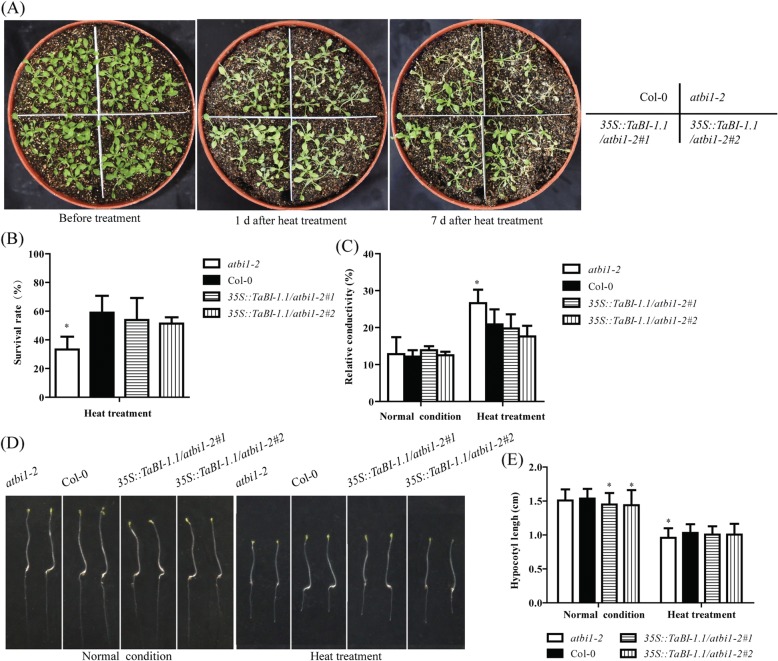
Fig. 2.
Constitutive TaBI-1.1 expression in atbi1–2 rescues the deficiency of atbi1–2 in heat tolerance. a The phenotypes of atbi1–2, Col-0, 35S::TaBI-1.1/atbi1–2#1, and 35S::TaBI-1.1/atbi1–2#2 under heat stress. b The survival rates of atbi1–2, Col-0, 35S::TaBI-1.1/atbi1–2#1, and 35S::TaBI-1.1/atbi1–2#2 under heat stress. The results are shown as the means±SD of three biological replicates. Error bars indicate the SD. c The relative conductivity of atbi1–2, Col-0, 35S::TaBI-1.1/atbi1–2#1, and 35S::TaBI-1.1/atbi1–2#2 after heat treatment. The results are shown as the means±SD of six biological replicates. Error bars indicate the SD. d Hypocotyl elongation in atbi1–2, Col-0, 35S::TaBI-1.1/atbi1–2#1, and 35S::TaBI-1.1/atbi1–2#2 after heat treatment. e Statistical analysis of hypocotyl elongation in atbi1–2, Col-0, 35S::TaBI-1.1/atbi1–2#1, and 35S::TaBI-1.1/atbi1–2#2 after heat treatment. The results are shown as the means±SD of 36 biological replicates. Error bars indicate the SD. All the asterisks in the figure (* and **) indicate significant differences (P < 0.05 and P < 0.01, respectively) compared with Col-0 (Student’s t-test)

