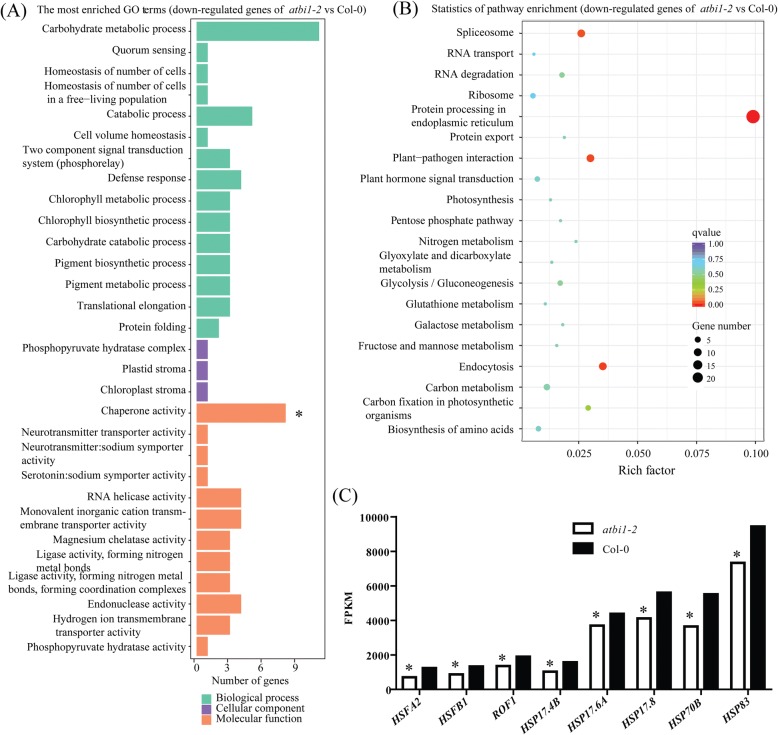
Fig. 5.
GO term enrichment and KEGG enrichment analyses were conducted using the RNA-seq data. a GO term enrichment analysis of the downregulated genes. The vertical coordinates are the enriched GO terms, and the horizontal coordinates are the numbers of the downregulated genes in these GO terms. The green columns represent the biological process GO terms; the purple columns represent the cellular component GO terms; the orange columns represent the molecular function GO terms. “*” indicates a significantly enriched GO term. b KEGG enrichment analysis of the downregulated genes. The vertical coordinates are the enriched pathways, and the horizontal coordinates are the rich factors. The size of each point represents the number of downregulated genes in the pathway, and the colour of the point represents the q-value. c FPKM values of the eight downregulated genes. Asterisks (*) indicate significant differences (padj< 0.005) compared with Col-0

