
Figure 1. Significant Differences in Patients from Baseline to Follow-Up.
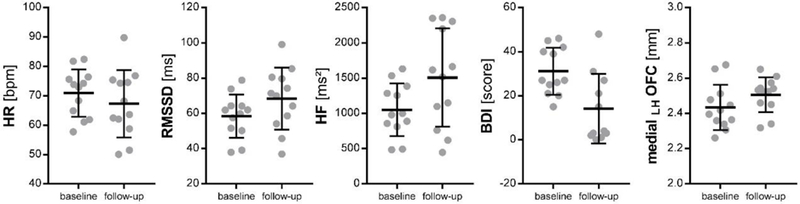
HR: heart rate; bpm: beats per minute; RMSSD: root of the mean squared difference of successive inter-beat-intervals; ms: milliseconds; HF: high-frequency heart rate variability; BDI: depressive symptoms assessed on the Beck Depression Inventory; LH: left hemisphere; OFC: orbitofrontal cortex; mm: millimeter; illustrated are means and standard deviations (SD) for each time point and patient.