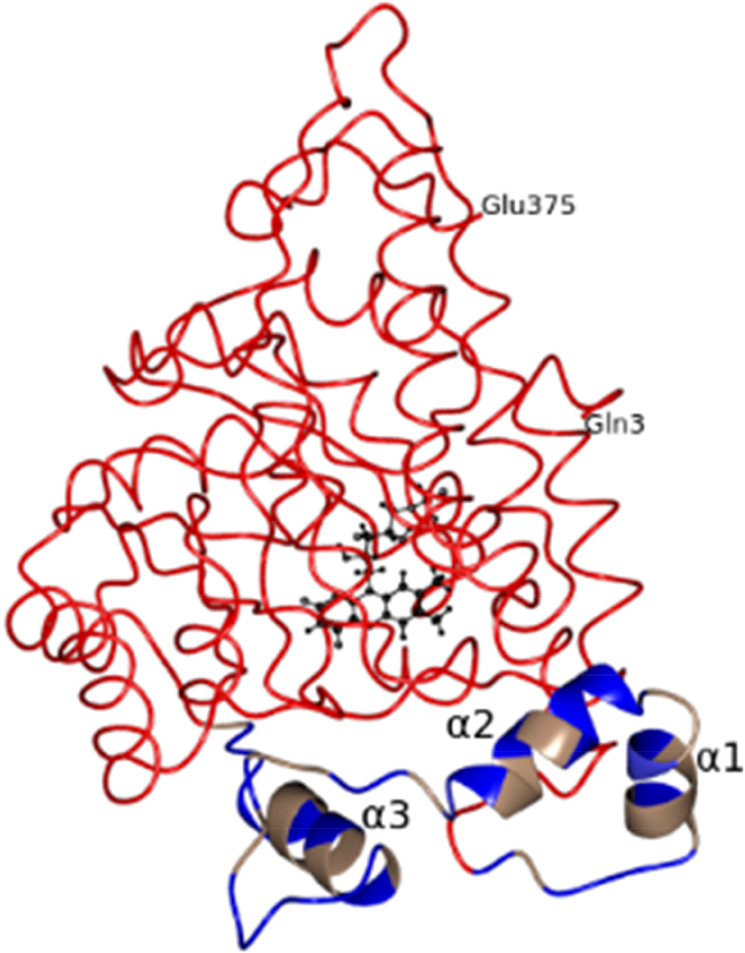
Fig.5.
Worm/Ribbon diagram of MDH. The membrane binding region is shown as a ribbon and colored based on hydrophobicity. Hydrophobic residues are in pale brown and nonhydrophobic residues are in blue color. The three α-helixes of the membrane binding region are marked as α1, α2 and α3. The rest of the molecule is shown as worms. FMN is shown as ball and stick in black color.

