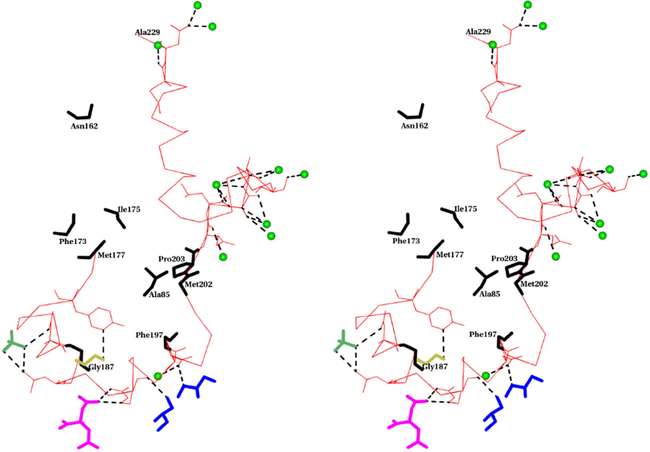
Fig.8.
Stereo view of the interactions of solvent and ion molecules with the membrane binding segment of molecule A of MDH (Residues 177–229). Cα- trace of the membrane binding segment is shown as a thin bond in red color. Residues which form hydrogen bonds are shown in full. The hydrogen bonds are shown as dotted lines in black color. Residues which are within 4A from DDM of MDH’s molecule B are shown as thick bonds in black color. Water molecules are shown as green spheres. Glycerol, SO4, Ethylene glycol and citric acid are shown as thick bonds in blue, lawn green, gold and magenta colors respectively.

