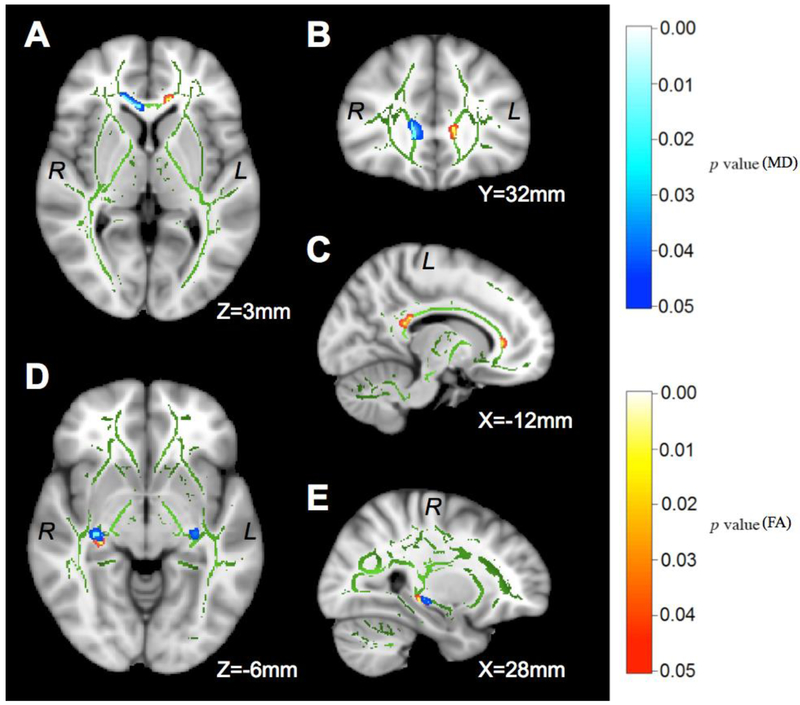
Figure 2.
t-statistical maps of TBSS analyses showing the DTI differences between ABST and REL at 1 month of abstinence. The TBSS skeleton (green) is overlaid on the MNI template (1 × 1 × 1 mm3) and displayed in sagittal, coronal, and axial views. The metric in the bottom-right corner indicates the distance from the anterior commissure. All significant clusters are FWE corrected (p<0.05). FA (red-yellow) is higher in ABST than REL in the genu (A and C) and splenium (C) of the corpus callosum, and the right stria terminalis (D and E). MD (blue-light blue) is higher in REL than ABST in the genu of the corpus callosum (A and B), the left (D) and right (D and E) stria terminalis. A cluster of lower MD in the left anterior corona radiata of REL versus ABST is not shown. See Table 2 for the corresponding statistics of each cluster. R/L: right/left hemisphere.

