
Fig. 1. ChRO-seq and leChRO-seq measure primary transcription in isolated chromatin.
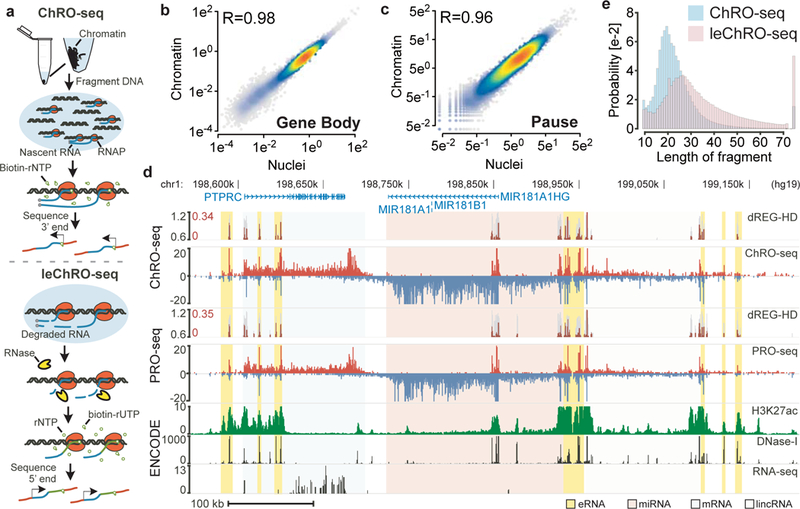
(a) Isolated chromatin is resuspended into solution, incubated with biotinylated rNTPs, purified by streptavidin beads, and sequenced from the 3’ end. leChRO-seq degrades existing RNA, extends nascent transcripts an average of 100 bp, and sequences RNAs from the 5’ end. (b and c) Comparison between matched ChRO-seq and PRO-seq in 41,478 RefSeq annotated gene bodies (b) or at the peak of paused Pol II (c). (d) Comparison between ChRO-seq (top three tracks), PRO-seq (center), and H3K27ac ChIP-seq, DNase-I-seq, and RNA-seq (bottom). dREG-HD shows the raw signal for dREG (gray) and dREG-HD signal (dark red). The shaded background shows the type of RNA produced at each position (e) The distribution of read lengths from ChRO-seq (blue) and leChRO-seq (pink) in a 30 year old primary GBM.