
Fig. 2. ChRO-seq detects transcription in primary human glioblastomas.
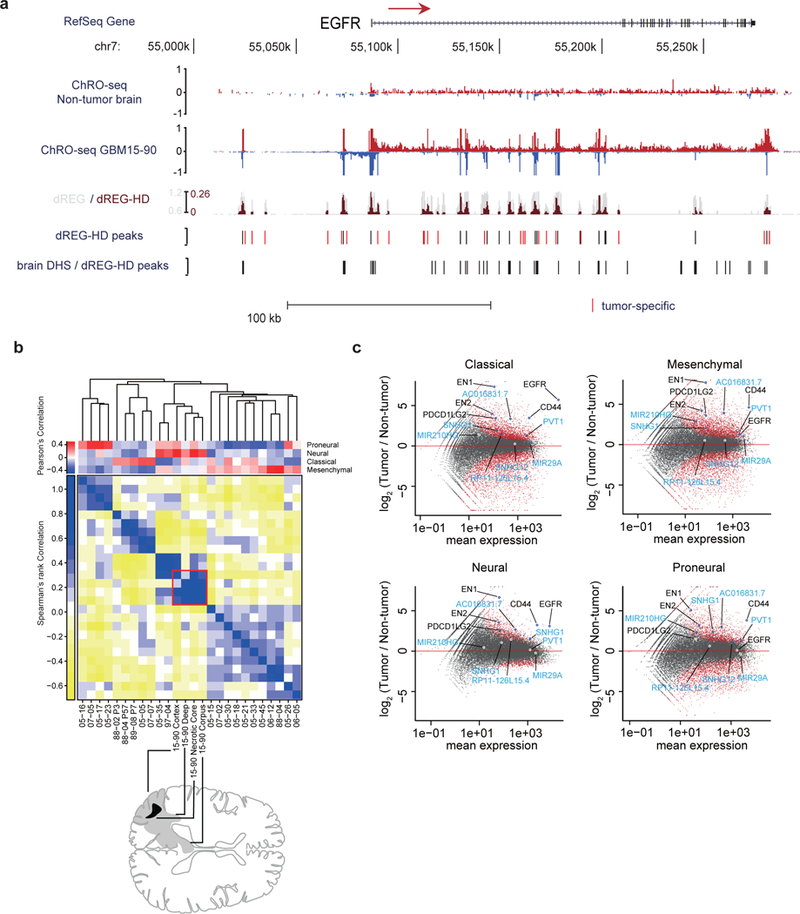
(a) RPM normalized ChRO-seq signal at the EGFR locus in nonmalignant brain (top) and GBM-15–90 (center). dREG (gray) and dREG-HD (dark red) signals are shown for GBM-15–90. dREG-HD peaks that are not DHSs in adult brain reference samples are highlighted in red. DHSs in 6 adult brain reference samples and dREG-HD peaks from the non-malignant brain sample. (b) Upper matrix: subtype scores for each patient, calculated by Pearson’s correlation with the centroid of gene expression of corresponding subtype. Lower matrix: Spearman’s rank correlation over subtype signature genes among 20 primary GBMs. Red square denotes four regions dissected from GBM-15–90. Sample order is based on single-link hierarchical clustering of the lower matrix, shown by the dendrogram. In total, 838 genes were used for calculating the correlation coefficients. (c) Differential gene transcription of primary GBMs in each subtype compared with non-malignant brain. Genes of interest are highlighted. lncRNAs are highlighted in blue.