
Fig. 3. Comparison between TREs in primary GBM / PDX and reference DHSs.
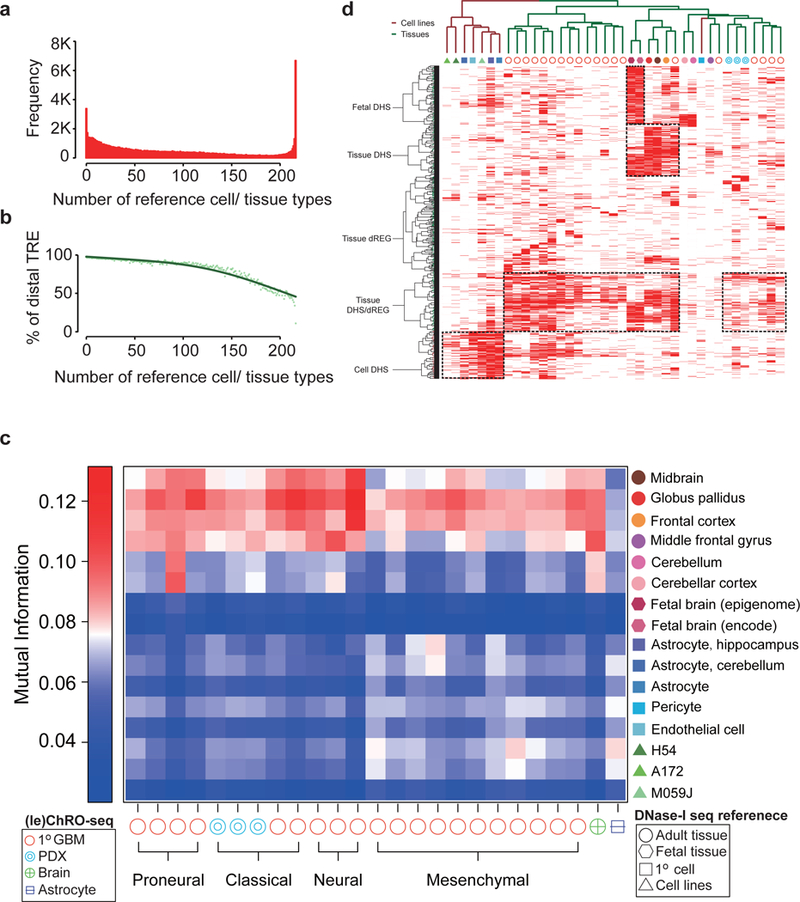
(a) Histogram representing the number of reference samples that have a DHS overlapping each dREG-HD site found in any of the 23 primary GBM / PDX samples. (b) Percentage of TREs >1kb from the nearest GENCODE transcription start site. (c) Mutual information between TREs in the indicated GBM and reference sample. (d) Clustering of reference samples with primary GBM / PDX based on the activation of TREs. Activate TREs are marked in red; inactive ones are in white.