
Fig. 4. Tumor associated TREs (taTREs) activate three regulatory programs.
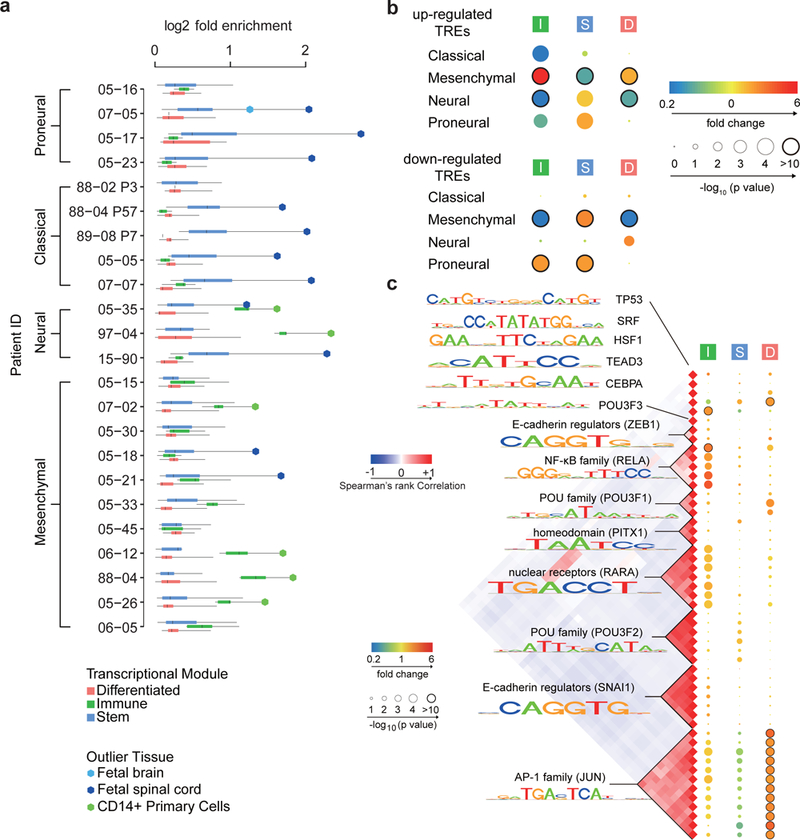
(a) Boxplots show the log2 fold enrichment of reference tissues enriched in the corresponding GBM. Reference samples enriched in each patient were grouped into three regulatory programs, called stem (blue, n= 24), immune (green, n= 5), and differentiated (pink, n= 21). Box plots show the 25th percentile (bottom of box), median (central bar), and 75th percentile (top of box). Whiskers represent minimum and maximum values. Outlier tissues are indicated in the legend. (b) The radius of the circle represents the p value (two-sided Fisher’s exact test) of enrichment of the indicated regulatory programs in subtype-biased TREs. The color represents the magnitude of enrichment (red) or depletion (blue). Number of subtype-biased TREs in each comparison (panels b and c) is shown in Supplementary Table 3 and 4. (c) Transcription factor binding motifs enriched in TREs of the immune (I), stem (S), and differentiated (D) regulatory program compared with TREs active in the normal brain. All motifs shown were significantly enriched following Bonferroni adjustment of the threshold p value in at least one patient (p < 0.05 / 1882, two-sided Fisher’s exact test). The Spearman’s rank correlation heatmap (left) shows the correlation in DNA binding sites matching each motif. The radius of the circle represents the median p value across patients is and the color represents the magnitude of enrichment (red) or depletion (blue).