
Fig. 5. Transcription factors influencing transcriptional heterogeneity in GBM.
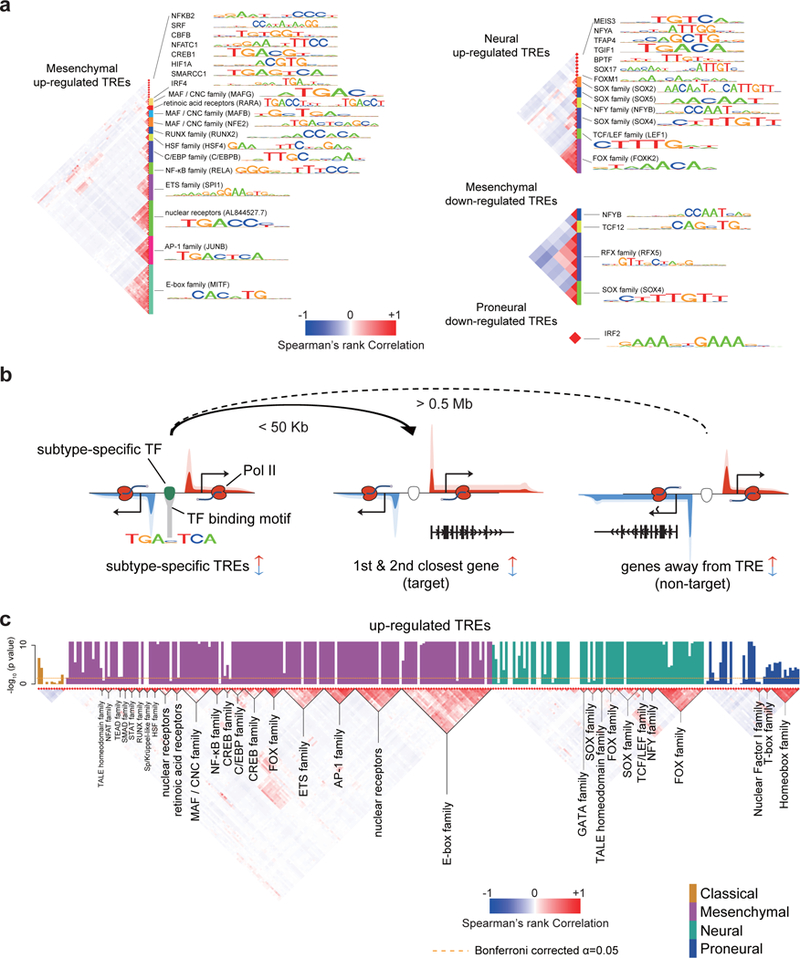
(a) Transcription factor binding motifs enriched in TREs that were up- or down-regulated in the indicated subtype. All motifs shown were significantly enriched following Bonferroni adjustment of the threshold p value (p < 0.05 / 1882, two-sided Fisher’s exact test; sample size shown in Supplementary Table 4). The Spearman’s rank correlation heatmap (left) shows the correlation in motif recognition. Families of transcription factors and their representative motifs are highlighted. (b) Cartoon illustrating heuristics used to identify target genes of subtype-specific transcription factor and for defining non-target (control) genes. Changes in transcription of both target and non-target genes are of the same direction as that of subtype-biased TREs. Target genes are the 1st and 2nd genes within 50 Kb of the TRE. Non-target genes are at least 0.5 Mb away. (c) Barplots show the -log10 Wilcoxon rank sum p value of having higher correlations among target genes of each transcription factor binding motif than a control set (columns; N=174 TCGA patients with RNA-seq data available). Barplots are colored by subtype in which they were found to be enriched (p < 0.05, two-sided Fisher’s exact test). The Spearman’s rank correlation between the binding sites of each motif is shown (bottom). Transcription factor families are indicated below the plot. The dotted line shows the Bonferroni adjusted threshold for the between-target validation experiment.