
Fig. 6. Regulatory activities of transcription factors are controlled by transcription and post-transcriptional mechanisms in GBM.
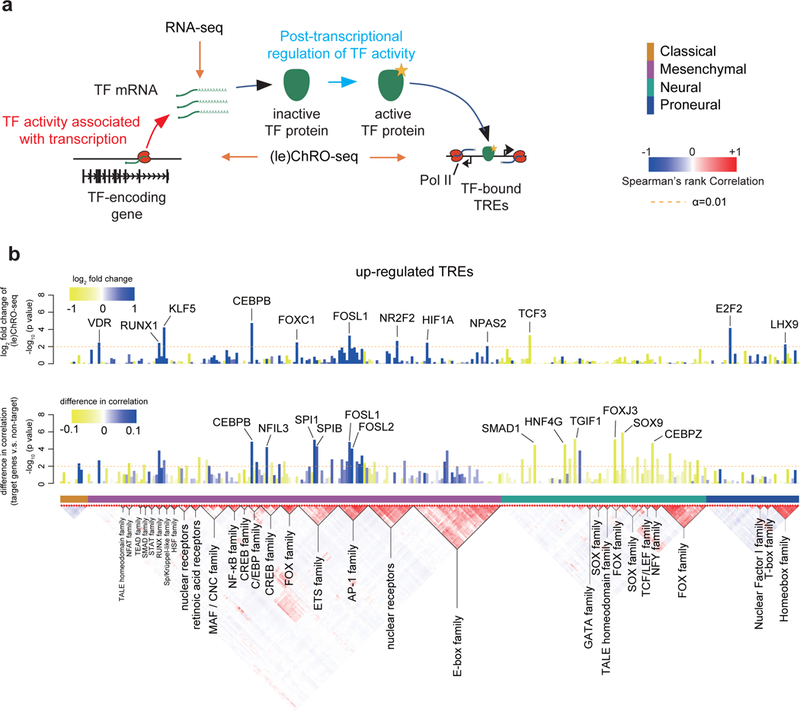
(a) The cartoon illustrates the stages at which transcription factor activities can be regulated and the corresponding signals detected by RNA-seq and (le)ChRO-seq. The activity of some transcription factors correlates predominantly with the abundance of its protein. Many transcription factors require post-transcriptional activation of the protein product before regulating target genes. (b) Barplot shows the FDR corrected -log10 p value (DESeq2, Wald test, n= 2 [classical] or 3 [other subtypes]) representing changes in Pol II abundance detected by (le)ChRO-seq on the gene encoding the indicated transcription factor. The level of upregulation (blue) and downregulation (yellow) in the subtype indicated by the colored boxes (below the barplot) is shown by the color scale. The dashed line shows the the FDR corrected α at 0.01. (c) Barplot shows the -log10 two-sided Wilcoxon rank sum test p value denoting differences in the distribution of correlations between the mRNA encoding the indicated transcription factor and either target or non-target control genes. The blue/ yellow color scale represents the median difference in correlation between target and non-target genes over 174 mRNA-seq samples. The dashed line shows the uncorrected α at 0.01.