
Fig. 7. Transcription factors control survival associated pathways in GBM.
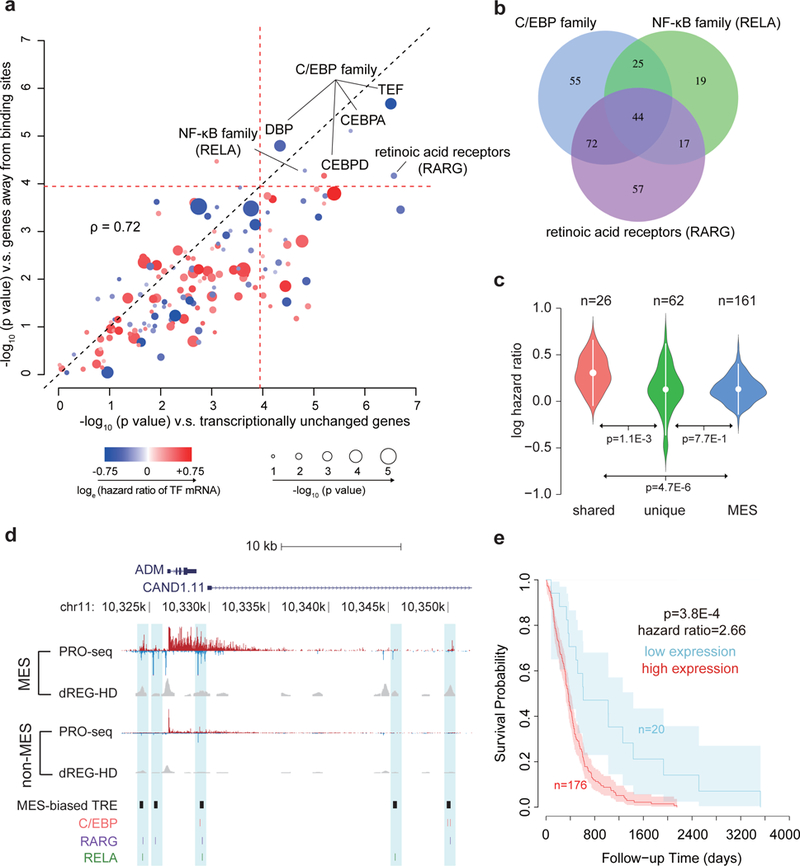
(a) Scatter plot shows the -log10 two-sided Wilcoxon rank sum test p value comparing the distribution of hazards ratios of target genes for each transcription factor and two groups of non-target control genes (see Online Methods). The radius of the circle denotes the -log10 p value of association between transcription factor mRNA levels and survival. Color denotes the loge of the hazard ratio at higher mRNA levels. The dotted red line represents the Bonferroni adjusted α threshold (0.05/ 432). (b) Venn diagram shows overlap between the target genes of the three indicated transcription factors. (c) Violin plot shows the loge hazard ratios for target genes shared among (left, N=26) and unique to (center, N=62) three transcription factors, and for mesenchymal marker genes (right, N=161). Mean hazard ratios are shown by white dots and standard deviations are shown by bars. P values were calculated by a two-sided Wilcoxon rank sum test. (d) Browser track of ADM shows the average of RPM normalized (le)ChRO-seq signals and dREG-HD scores in mesenchymal (MES, n= 3) and non-MES (n= 8) GBMs. MES-biased TREs and motif positions are highlighted in blue. (e) Kaplan–Meier plot shows overall survival between 196 patients with high and low average expression level of 26 shared target genes. The cutoff was determined based on the minimum p value in the difference between survival time using a two-sided Chi-squared test. Shaded regions mark the 95% confidence interval.