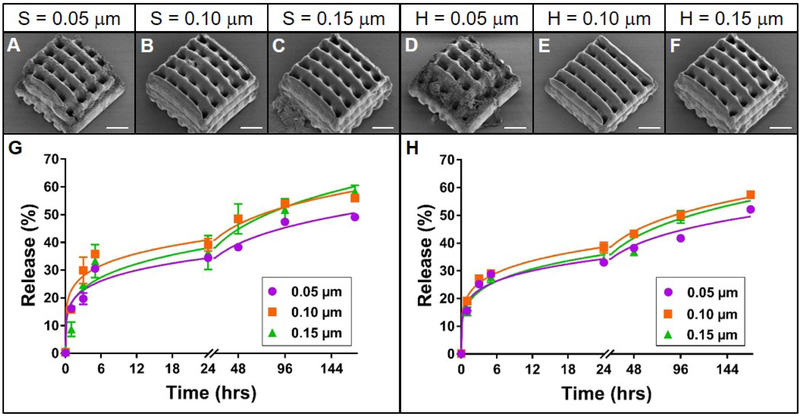
Figure 4. Effect of slicing and hatching distance on rhodamine B release from TPP woodpile structures.
A-F: Representative scanning electron micrographs of PEG woodpile structures with 10 μm cylinders created using a slicing distance of 0.05, 0.1 or 0.15 μm at constant hatching distance or a hatching distance of 0.05, 0.1 or 0.15 μm at a constant slicing distance, respectively. Scale bars represent 25 μm. G-H: Release profiles (data points) and best-fit Korsmeyer-Peppas regression curves (lines) of rhodamine B diffusion from the devices shown in A-F with varying slicing (G) or hatching (H) distances. Error bars represent standard error of the mean; n=3.

