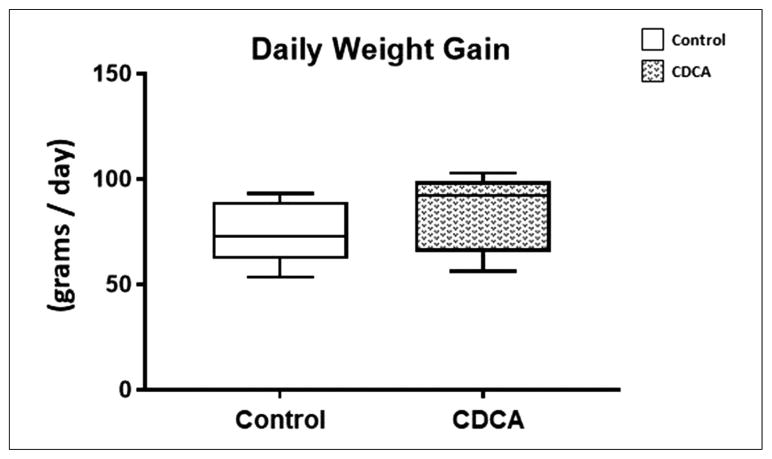
Figure 1.
Daily weight gain for control and chenodeoxycholic acid (CDCA)-treated animals. Box and whisker plots are shown. Boxes represent the 25th–75th percentile, and central lines represent median values. A Mann-Whitney U test was conducted to determine P-value. All test were 2-sided using a significance level of 0.05. Note that there were no differences in daily weight gain between the 2 groups.

