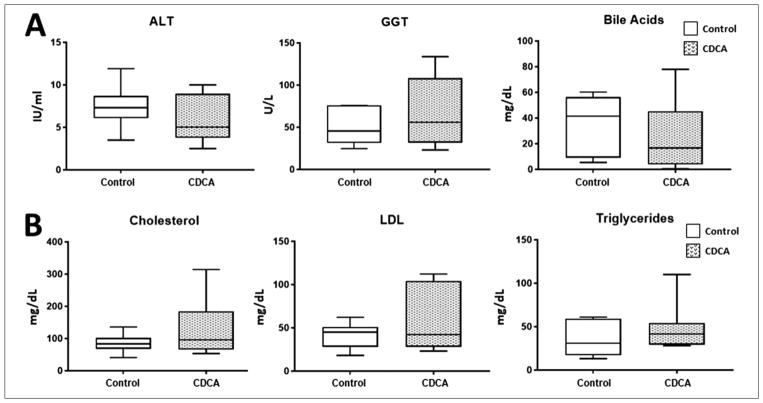
Figure 4.
(A) Serum alanine aminotransferase (ALT), γ-glutamyltransferase (GGT), and bile acids levels. (B) Serum cholesterol, low-density lipoprotein (LDL), and triglyceride levels. Box and whisker plots are shown. Boxes represent the 25th–75th percentile, and central lines represent median values. A Mann-Whitney U test was conducted to determine P-value. All tests were 2-sided using a significance level of 0.05. Note that there were no differences in serum ALT, GGT, bile acid, cholesterol, LDL, or triglyceride levels between the groups.

