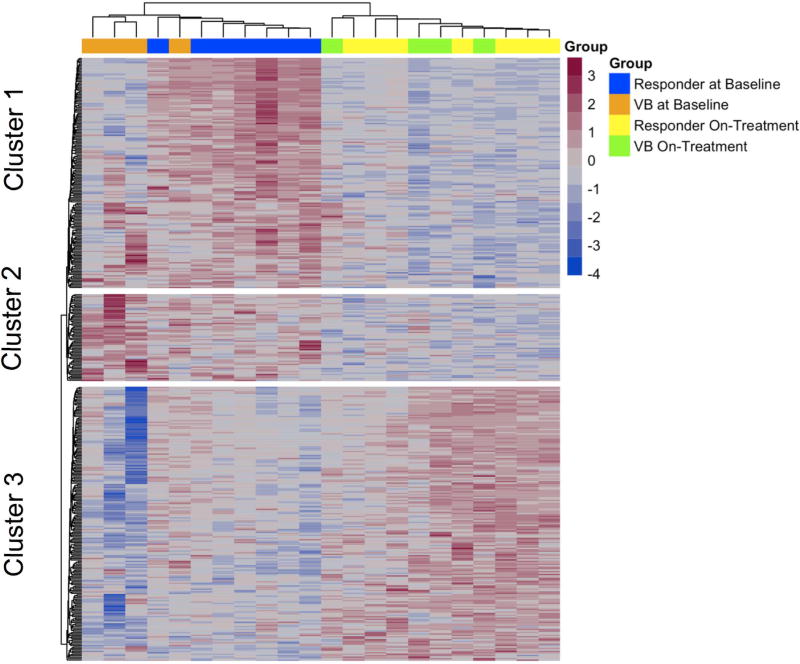
Figure 2. Expression data for the 408 differentially expressed genes from the pre-treatment and on-treatment week 2/4 liver biopsies during DAA therapy.
The heat map shows the 408 differentially expressed genes at baseline liver biopsy and on-treatment liver biopsies during DAA therapy. Blue bars above the heatmap indicate gene expression data at the baseline liver biopsy from patients who responded to DAA treatment. Orange bars indicate gene expression data at the baseline liver biopsy from patients who experienced virological breakthrough to DAA treatment. Yellow bars indicate gene expression data at the on-treatment liver biopsy from patients who responded to DAA treatment. Green bars indicate gene expression data at the on-treatment liver biopsy from patients who experienced virological breakthrough to DAA treatment. Expression of a distinct cluster of genes at baseline, Cluster 1, differed significantly between patients who achieved SVR12 (responders) compared to three of four patients that subsequently experienced a virological breakthrough during DAA therapy.

