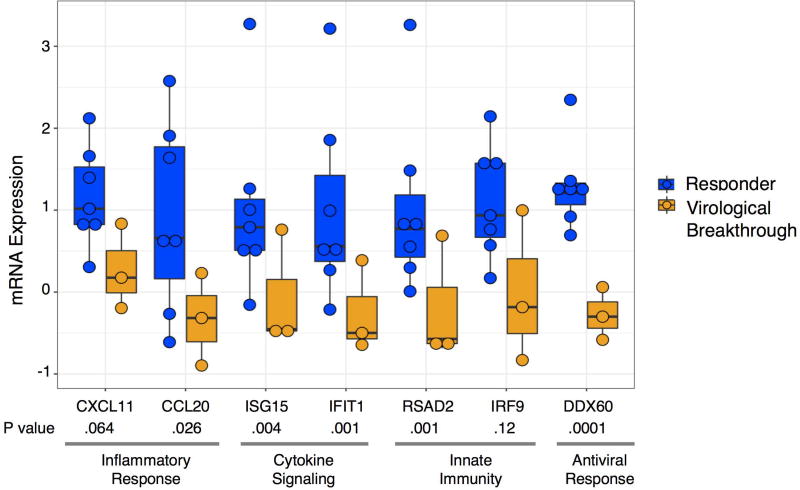
Figure 4. Gene expression by NanoString at baseline based on response to DAA treatment.
Shown are seven ISGs measured by NanoString representing different components of the innate immune response demonstrating higher expression among patients who achieved SVR12 compared to those with virological breakthrough. Each dot represents an individual patient. Note that the Nanostring data from one patient with virological breakthrough is missing from this analysis due to technical problems with the assay, which probably explains the lack of significance for CXCL11 and IRF9 with the NanoString data (expression levels were significant using microarray data). Patients who responded to DAA therapy are shown in blue and those who experienced virological breakthrough are shown in orange. The bar within the boxes represent the median gene expression and the upper and lower boundaries of the boxes represent the 75th and 25th percentiles of gene expression.

