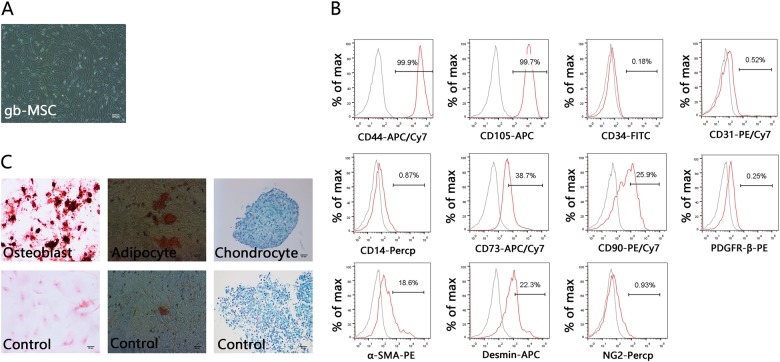
Fig. 1. Isolation and characterization of gbMSCs derived from human high-grade glioma tissues.
a Adherent growth pattern of gbMSCs cultured in 10% DMEM (×40, scale bars = 200 μm). b FACS analysis of typical gbMSCs (n ≥ 3) in culture. c Tri-lineage differentiation of gbMSCs: gbMSCs were treated with specific conditions for osteogenic differentiation (upper left), adipogenic differentiation (upper middle), and chondrogenic differentiation (upper right) (×200, scale bars = 50 μm). The lower panels show staining of cells grown in MSC medium as a control

