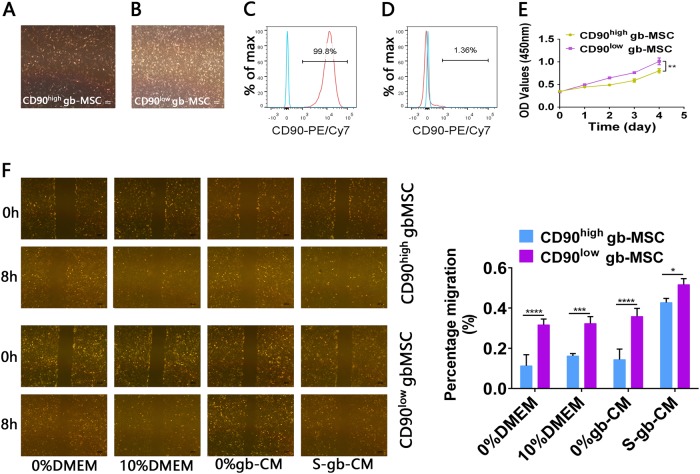
Fig. 2. Characteristics of CD90highand CD90low gbMSCs cultured in vitro.
a, b Adherent growth patterns of CD90high and CD90low gbMSCs cultured in 10% DMEM (×40, scale bars = 200 µm). c FACS analysis of sorted CD90high gbMSCs (n ≥ 3). d FACS analysis of sorted CD90high gbMSCs (n ≥ 3). e Growth of CD90high and CD90low gbMSCs cultured in 10% DMEM (n ≥ 3). *P < 0.05, **P < 0.01. f Wound-healing assay of CD90high and CD90low gbMSCs (n ≥ 3) for 8 h with different media (×40, scale bars = 200 µm). *P < 0.05, **P < 0.01, ***P < 0.001 and ****P < 0.0001

