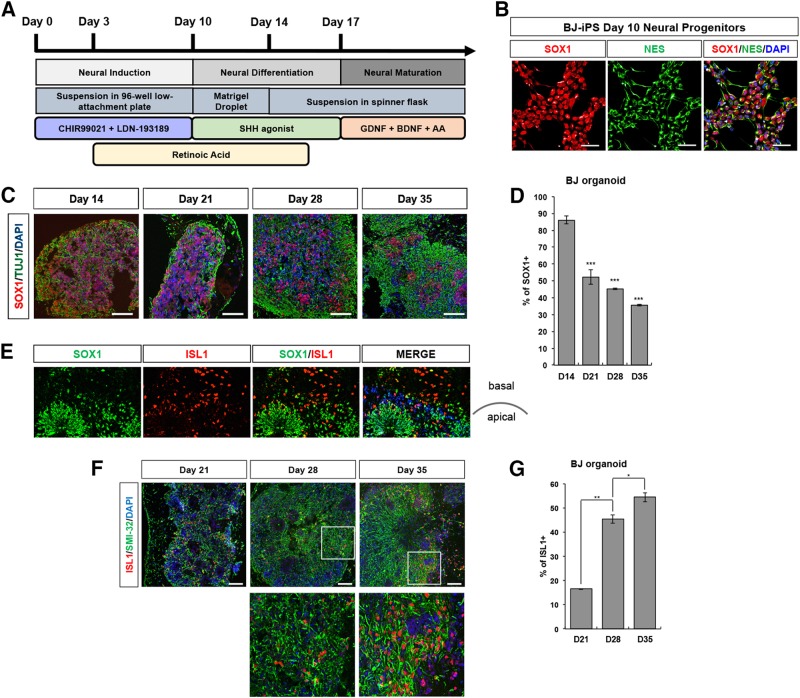
Fig. 1. Generation of three-dimensional spinal organoids from human iPSCs.
a Schematic illustration of spinal organoids differentiation from iPSC. b Co-staining of SOX1 (red) and Nestin (green) illustrating successful generation of neural progenitors in BJ-iPS motor neuron cultures. Cellular nuclei were counterstained with DAPI. Scale bars, 50 μm. c Representative images BJ-iPS spinal organoids at respective time points stained with SOX1 (red) and TUJ1 (green). Cellular nuclei were counterstained with DAPI. Scale bars, 100 μm. d Quantification of SOX1+ levels percentage of BJ-iPS spinal organoids at respective time points relative to total cell number. e Representative images of BJ-iPS spinal organoids demonstrating SOX1+ (green) and ISL1+ (red) in an apical-to-basal patterning. Cellular nuclei were counterstained with DAPI. Scale bars, 100 μm. f Representative images of BJ-iPS spinal organoids at respective time points stained with ISL1 (red) and SMI-32 (green). Cellular nuclei were counterstained with DAPI. Scale bars, 100 μm. g Graph shows percentage of ISL1+ at day 21, 28, and 35 in BJ-iPS spinal organoids relative to total cell number. *p < 0.05, **p < 0.01, ***p < 0.001

