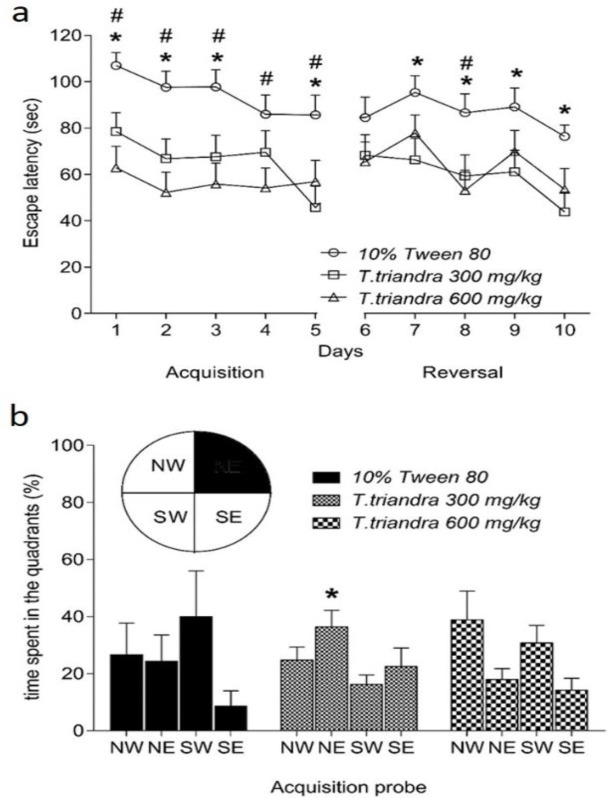
Figure 1.
Spatial learning (Day 1-5) and learning flexibility (Day 6-10) represented by the escape latency (a). Spatial memory was tested in the probe trial (b) represented by the percentage of time spent in the target quadrant (northeast; NE). * indicates a significant difference at p<0.05 between T. triandra 300 mg/ kg group and 10% Tween 80 group. # indicates a significant difference at p<0.05 between T.triandra 600 mg/kg group and 10% Tween 80 group

