Figure 3.

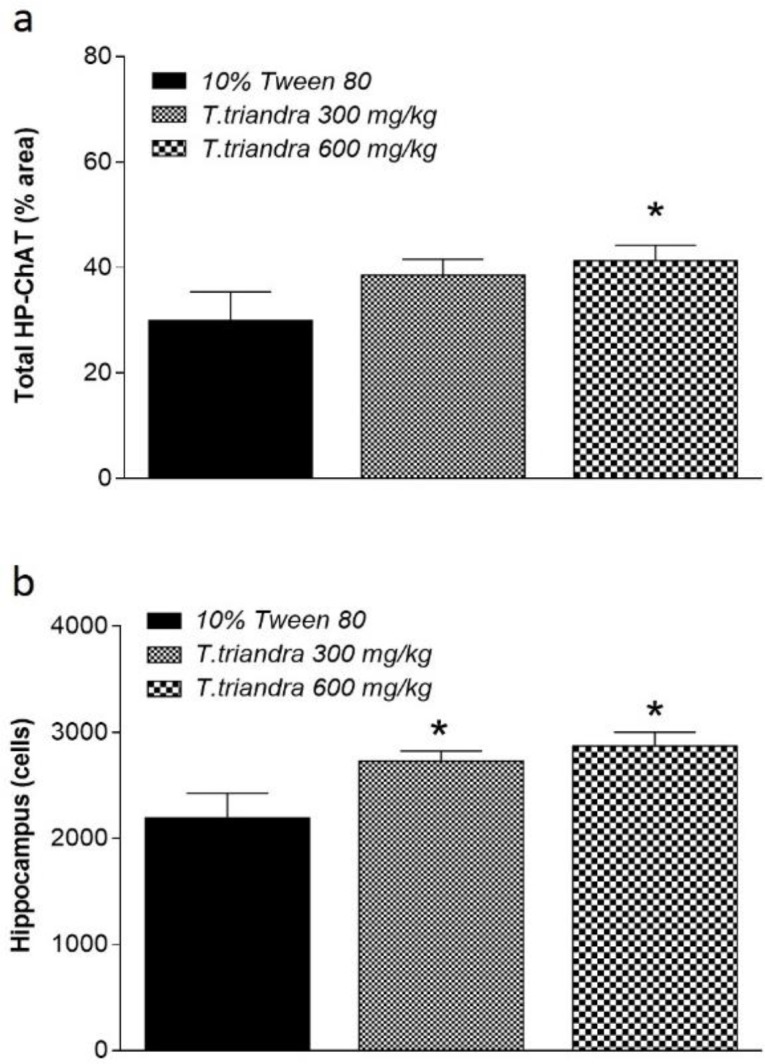
Histogram of total hippocampus (HP) ChAT labeling density (a) and total viable cells number in the dorsal hippocampus (b). * indicates significant difference at p<0.05 as compared to mice treated with 10% Tween 80

Histogram of total hippocampus (HP) ChAT labeling density (a) and total viable cells number in the dorsal hippocampus (b). * indicates significant difference at p<0.05 as compared to mice treated with 10% Tween 80