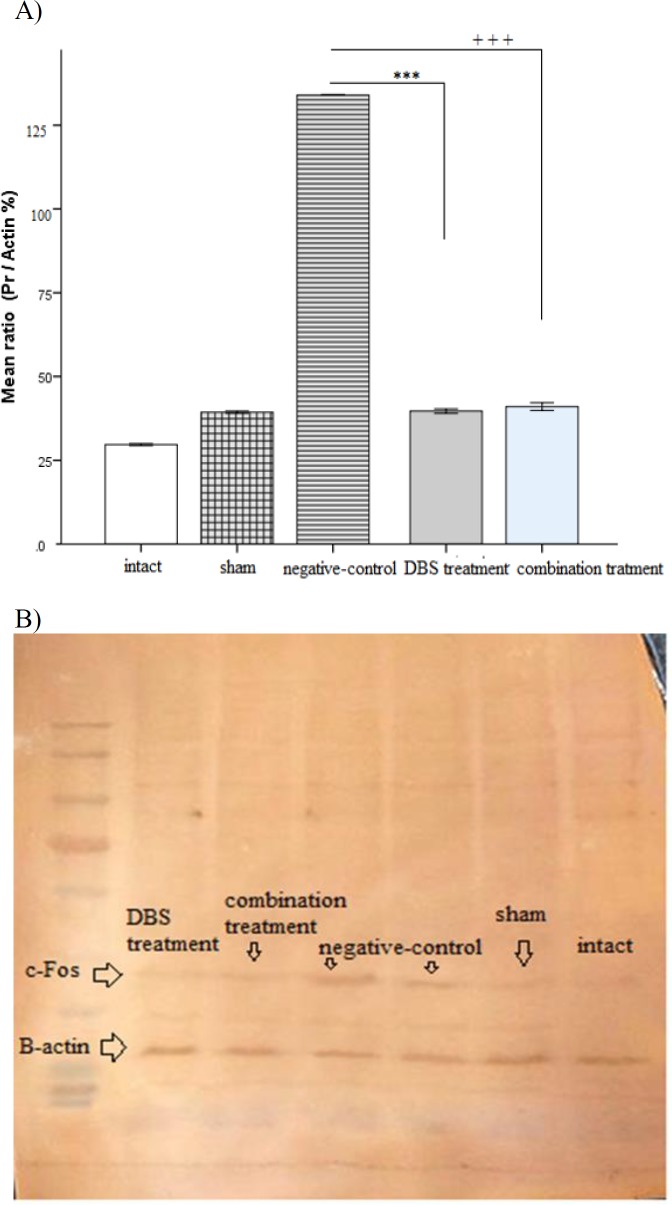
Figure 4.
A) The amygdala c-Fos expression presented after the re-exposure time in the groups. ***p<0.001 and +++p<0.001 show significant differences as compared to negative control group. B) Western-blot analysis of c-Fos protein expression. There was a significant difference among group’s bands which declared the effect of DBS treatment

