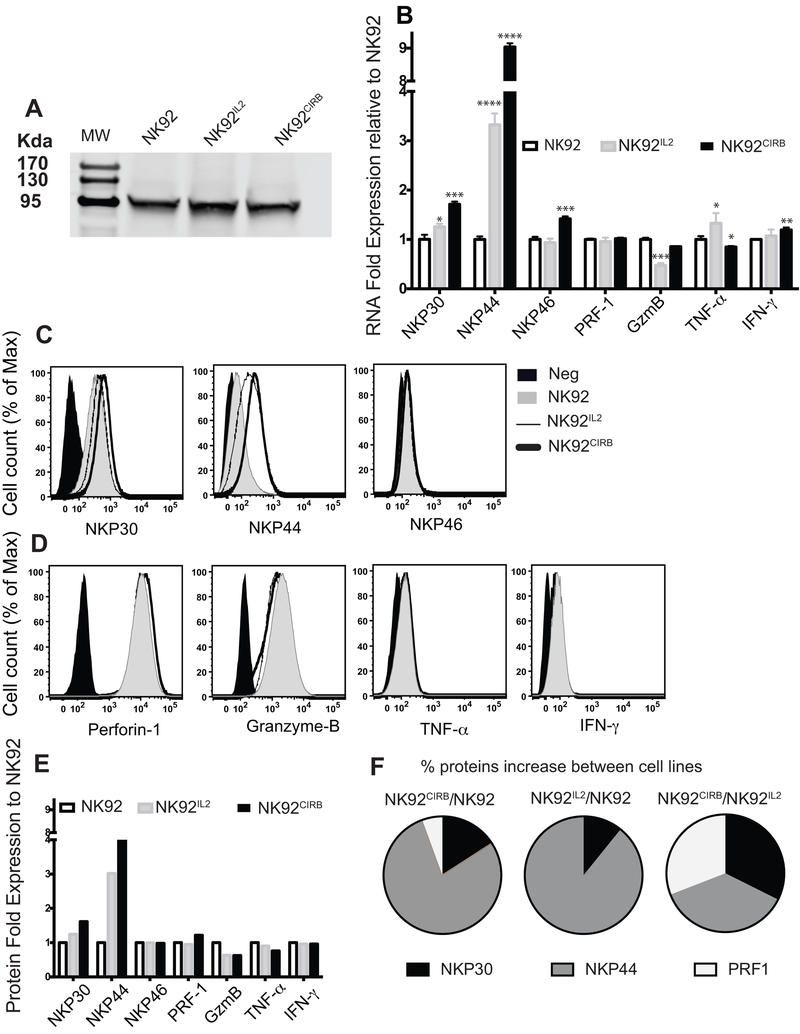
Figure 5.
Natural cytotoxity receptors and effectors in NK cell lines. A, Stat 5 phosphorylation is equivalent in NK92 and NK92CIRB cells and higher by 17% in NK92IL2 as determined by ImageJ software. B, Gene expression profiles of NKP30, NKP44, NKP46, Granzyme-B, Perforin-1, TNF-α, and INF-γ in NK cells lines determined by qRT-PCR. Primers sequences in Supplementary Table S1. Results were analyzed using comparative CT (ΔΔCT) method and are presented as RNA folds relative to NK92 after normalization to the GAPDH RNA content of each sample. Data are presented as mean + SE values for triplicate samples. Two tails t-test analysis was used to evaluate statistical differences. C, Surface expression by flow cytometry of NKP30, NKP44, NKP46 and D, Granzyme-B, Perforin-1, TNF-α, and INF-γ. E, Statistical ∑Median values derived from data in (C) and (D) using FlowJo statistical module for 3×10⁵ cells analyzed. F, Visualization of the percentage increase of markers expression between NK cell lines pairs.

