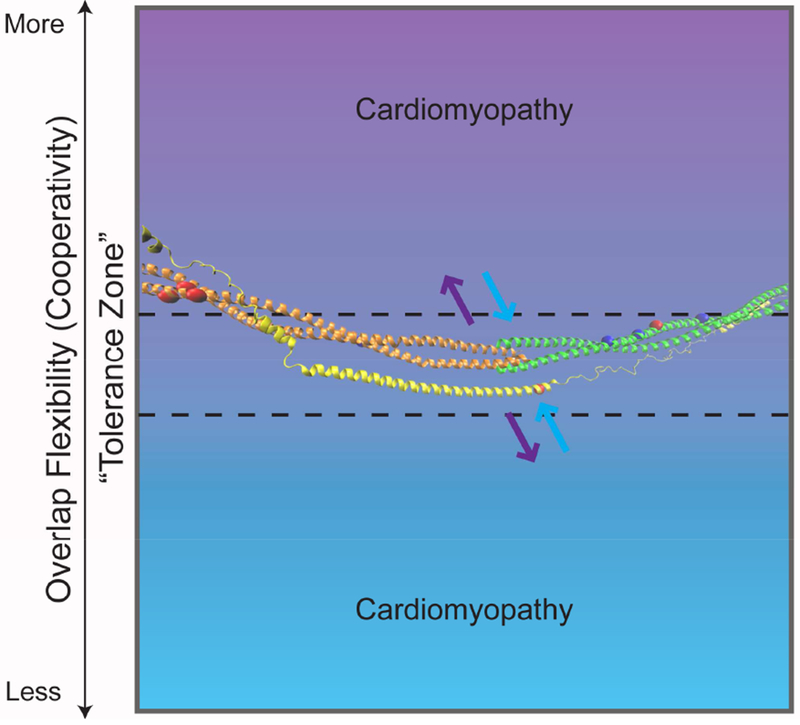
Figure 4:

Tm-Overlap Flexibility including the proposed “tolerance zone”. The semi-flexible Tm-overlap can vary within this zone (dotted line), becoming more (purple) or less (blue) flexible, outside of which is associated with disease. Overlaid on the gradient is the atomistic model generated from the publicly available average structure, by JR Exequiel Pineda, of the Tm N-terminus (orange), Tm C-terminus (green), and the N-terminal extension of cTnT (yellow) [1]. The arrows represent decreased (purple) or increased (blue) interaction of the five-helix bundle that comprises the Tm-overlap. Included on the Tm and cTnT model are the sites of the discussed mutations (Tm-D175, E180, L185, E62, E40, E54, D84, D230; cTnT R92) with HCM in red and DCM in dark blue.
