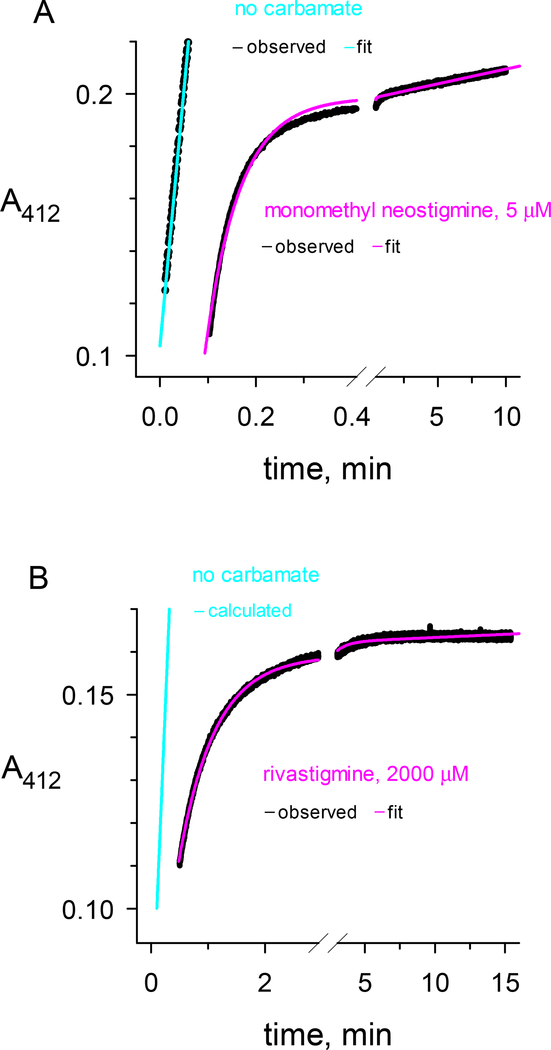
Figure 2.
Reactions of the carbamates a) N-monomethyl neostigmine and b) rivastigmine with hAChE. The carbamates or buffer blanks were mixed with hAChE in a stopped-flow apparatus and reactions were monitored at 412 nm with 0.25 mM acetylthiocholine and 2.0 mM DTNB as outlined in the Experimental Procedures (black traces labeled “observed”). The reaction data for carbamates were fitted to Eq. 2 (pink traces labeled “fit”) with R set to zero, either t0 or A412(t0) fixed at a value determined by inspection or from controls without enzyme, and with v0, A412(t0), k12 and k21 as the fitted parameters. The reaction data for blanks without carbamate gave a linear fit in panel A (cyan trace labeled “fit”) or a linear fit in panel B that was calculated by normalizing panel A data to the AChE concentration (cyan trace labeled “calculated”). a) Final concentrations of N-monomethyl neostigmine and hAChE after mixing were 5.0 μM and 2.0 nM, respectively. Fitting to Eq. 2 with t0 fixed at 0.100 min gave k12 = 14 min−1 and k21 = 13 × 10−3 min−1. b) Final concentrations of rivastigmine and hAChE after mixing were 2.0 mM and 0.33 nM, respectively. Fitting to Eq. 2 with A412(t0) fixed at 0.114 min gave k12 = 1.24 min−1 and k21 = 3.1 × 10⁻³ min−1. The carbamate trace in panel b was offset by 0.5 min.

