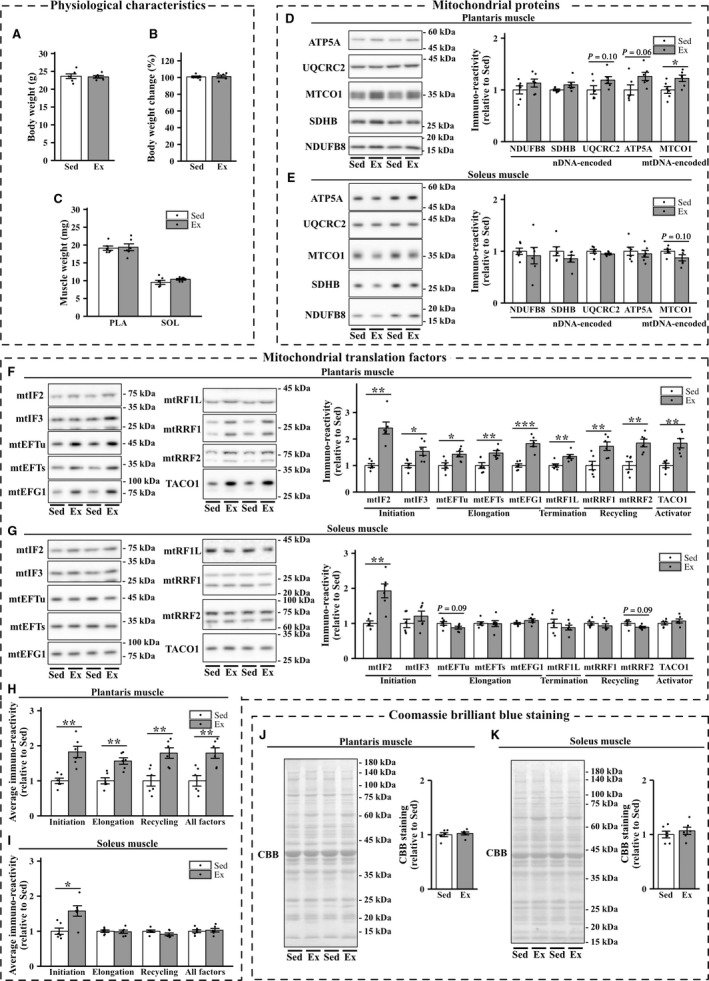
Figure 5.

Effects of 1‐week exercise training on the expression of mitochondrial proteins and mitochondrial translation factors in the plantaris and soleus muscles. Body weight (A), body weight change (B), and muscle weight (C) in sedentary mice (Sed) and exercised mice (Ex). (D–G) Representative immunoblots and quantifications of OXPHOS protein levels (D and E) and those of mitochondrial translation factors (F and G) in the plantaris and soleus muscles of sedentary and exercised groups of mice. (J and K) Representative images and quantifications of Coomassie brilliant blue (CBB) staining. Values are mean ± SEM; dot plot represents individual data points; n = 6 per group. *P < 0.05 vs. Sed. **P < 0.01 vs. Sed. ***P < 0.001 vs. Sed.
