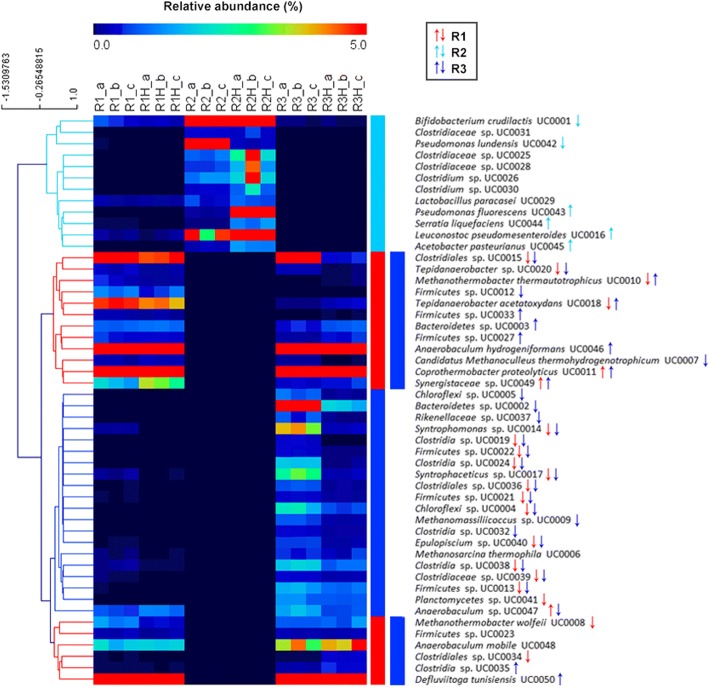
Fig. 3.
Heat map of relative abundance of the 50 MAGs (R1 and R1H: single stage pre- and post-H2, respectively; R2 and R2H: acidogenic reactor of the two-stage pre- and post-H2, respectively; R3 and R3H: methanogenic reactor of the two-stage pre- and post-H2, respectively; a–c: replicates). Up and down arrows indicate the statistically significant shifts in abundance of the MAGs (increase and decrease, respectively) between the two conditions (pre-/post-H2)

